Estimated Value: $61,000 - $85,000
2
Beds
2
Baths
1,119
Sq Ft
$67/Sq Ft
Est. Value
About This Home
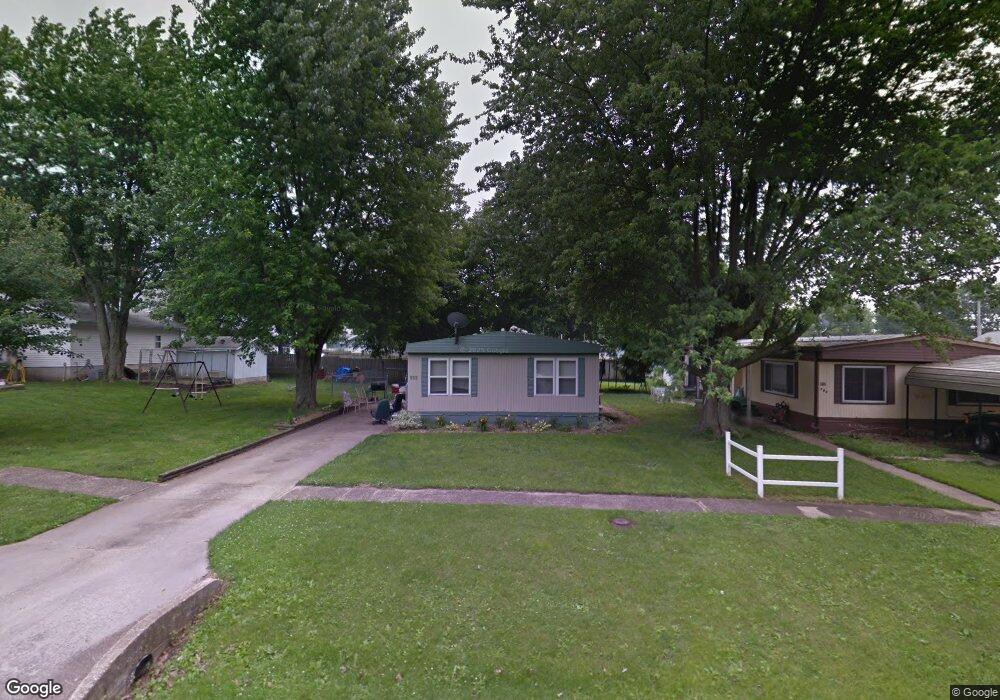
This home is located at 333 W Frick St, Macon, IL 62544 and is currently estimated at $74,752, approximately $66 per square foot. 333 W Frick St is a home located in Macon County with nearby schools including Meridian Middle School and Meridian High School.
Ownership History
Date
Name
Owned For
Owner Type
Purchase Details
Closed on
Aug 9, 2021
Sold by
Brooks Matthew
Bought by
Rowcliff Jason M and Rowcliff Melissa A
Current Estimated Value
Home Financials for this Owner
Home Financials are based on the most recent Mortgage that was taken out on this home.
Original Mortgage
$41,600
Outstanding Balance
$37,827
Interest Rate
2.9%
Mortgage Type
New Conventional
Estimated Equity
$36,925
Purchase Details
Closed on
May 25, 2012
Sold by
Odell Jared B and Odell Leslie A
Bought by
Brooks Matthew
Purchase Details
Closed on
May 7, 2007
Sold by
Steiling Eric
Bought by
Odell Jared B and Odell Leslie A
Home Financials for this Owner
Home Financials are based on the most recent Mortgage that was taken out on this home.
Original Mortgage
$20,000
Interest Rate
6.75%
Mortgage Type
Adjustable Rate Mortgage/ARM
Purchase Details
Closed on
Nov 1, 2003
Create a Home Valuation Report for This Property
The Home Valuation Report is an in-depth analysis detailing your home's value as well as a comparison with similar homes in the area
Home Values in the Area
Average Home Value in this Area
Purchase History
| Date | Buyer | Sale Price | Title Company |
|---|---|---|---|
| Rowcliff Jason M | $26,000 | None Available | |
| Rowcliff Jason M | $26,000 | None Listed On Document | |
| Brooks Matthew | $28,500 | None Available | |
| Odell Jared B | $25,000 | None Available | |
| -- | $25,000 | -- |
Source: Public Records
Mortgage History
| Date | Status | Borrower | Loan Amount |
|---|---|---|---|
| Open | Rowcliff Jason M | $41,600 | |
| Closed | Rowcliff Jason M | $20,800 | |
| Previous Owner | Odell Jared B | $20,000 |
Source: Public Records
Tax History Compared to Growth
Tax History
| Year | Tax Paid | Tax Assessment Tax Assessment Total Assessment is a certain percentage of the fair market value that is determined by local assessors to be the total taxable value of land and additions on the property. | Land | Improvement |
|---|---|---|---|---|
| 2024 | $900 | $12,116 | $3,212 | $8,904 |
| 2023 | $849 | $10,977 | $2,910 | $8,067 |
| 2022 | $836 | $10,484 | $2,779 | $7,705 |
| 2021 | $826 | $9,959 | $2,640 | $7,319 |
| 2020 | $819 | $9,385 | $2,488 | $6,897 |
| 2019 | $819 | $9,385 | $2,488 | $6,897 |
| 2018 | $802 | $9,162 | $2,429 | $6,733 |
| 2017 | $803 | $9,200 | $2,439 | $6,761 |
| 2016 | $827 | $9,189 | $2,436 | $6,753 |
| 2015 | $795 | $8,921 | $2,365 | $6,556 |
| 2014 | $754 | $8,833 | $2,342 | $6,491 |
| 2013 | $769 | $8,833 | $2,342 | $6,491 |
Source: Public Records
Map
Nearby Homes
- 275 W Cole St
- 161 N Front St
- 206 W Andrews St
- 124 Robin Dr
- 501 W Walker Rd Unit Macon Illinois 62544
- Lot 13 Galeana Dr
- Lot 52 Galeana Dr
- Lot 12 Galeana Dr
- Lot 51 Galeana Dr
- Lot 50 Galeana Dr
- Lot 5 Galena Dr
- Lot 6 Galena Dr
- Lot 7 Galena Dr
- Lot 8 Galena Dr
- Lot 10 Galena Dr
- Lot 11 Galeana Dr
- Lot 9 Galeana Dr
- Lot 49 Galeana Dr
- Lot 14 Lakelaine Dr
- Lot 15 Lakelaine Dr