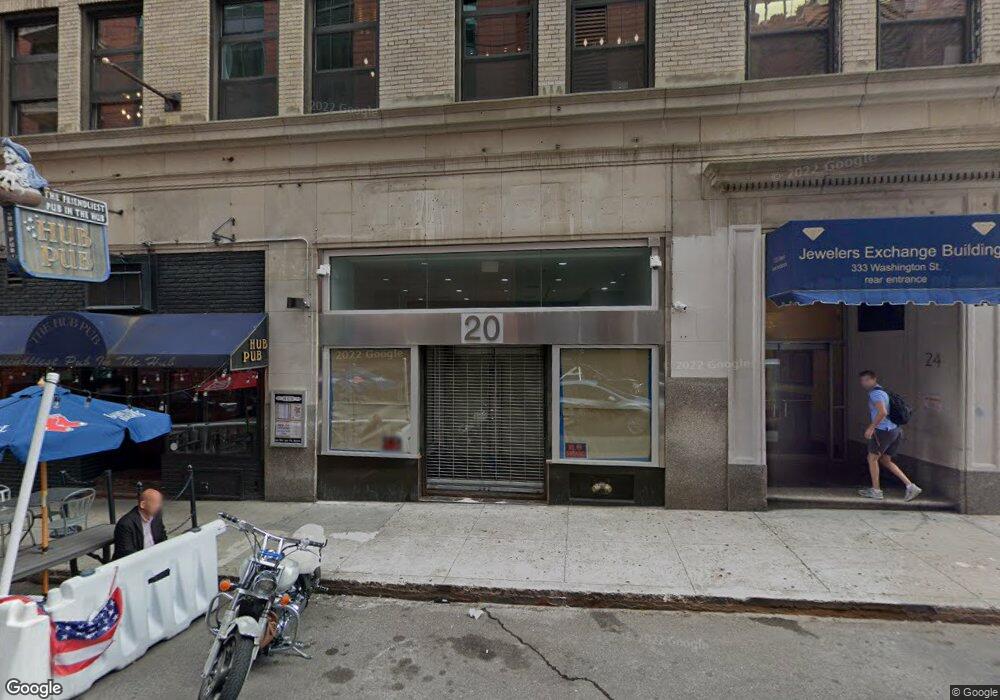
333 Washington St Unit 203-4 Boston, MA 02108
Downtown Boston NeighborhoodEstimated Value: $430,505
--
Bed
--
Bath
275
Sq Ft
$1,565/Sq Ft
Est. Value
About This Home
This home is located at 333 Washington St Unit 203-4, Boston, MA 02108 and is currently estimated at $430,505, approximately $1,565 per square foot. 333 Washington St Unit 203-4 is a home located in Suffolk County with nearby schools including St John School, Torit Montessori School, and Advent School.
Ownership History
Date
Name
Owned For
Owner Type
Purchase Details
Closed on
Mar 14, 2013
Sold by
Kazaka John M
Bought by
Accutek Industries Inc
Current Estimated Value
Home Financials for this Owner
Home Financials are based on the most recent Mortgage that was taken out on this home.
Original Mortgage
$150,000
Outstanding Balance
$105,851
Interest Rate
3.54%
Mortgage Type
Commercial
Estimated Equity
$324,654
Purchase Details
Closed on
Dec 11, 1996
Sold by
Riccio Ronald A and Riccio Alfred A
Bought by
Kazaka John M
Purchase Details
Closed on
Jul 31, 1989
Sold by
Breagy Charles
Bought by
Riccio Ronald A
Purchase Details
Closed on
Jul 10, 1987
Sold by
Cable Austin L
Bought by
Breagy Charles
Home Financials for this Owner
Home Financials are based on the most recent Mortgage that was taken out on this home.
Original Mortgage
$78,000
Interest Rate
10.71%
Mortgage Type
Commercial
Create a Home Valuation Report for This Property
The Home Valuation Report is an in-depth analysis detailing your home's value as well as a comparison with similar homes in the area
Home Values in the Area
Average Home Value in this Area
Purchase History
| Date | Buyer | Sale Price | Title Company |
|---|---|---|---|
| Accutek Industries Inc | $190,000 | -- | |
| Kazaka John M | $98,000 | -- | |
| Kazaka John M | $98,000 | -- | |
| Riccio Ronald A | $77,500 | -- | |
| Riccio Ronald A | $77,500 | -- | |
| Breagy Charles | $97,200 | -- |
Source: Public Records
Mortgage History
| Date | Status | Borrower | Loan Amount |
|---|---|---|---|
| Open | Accutek Industries Inc | $150,000 | |
| Closed | Breagy Charles | $150,000 | |
| Previous Owner | Breagy Charles | $78,000 |
Source: Public Records
Tax History Compared to Growth
Tax History
| Year | Tax Paid | Tax Assessment Tax Assessment Total Assessment is a certain percentage of the fair market value that is determined by local assessors to be the total taxable value of land and additions on the property. | Land | Improvement |
|---|---|---|---|---|
| 2025 | $3,068 | $118,200 | $0 | $118,200 |
| 2024 | $3,237 | $128,100 | $0 | $128,100 |
| 2023 | $3,282 | $133,000 | $0 | $133,000 |
| 2022 | $3,282 | $131,400 | $0 | $131,400 |
| 2021 | $3,339 | $136,000 | $0 | $136,000 |
| 2020 | $3,389 | $136,000 | $0 | $136,000 |
| 2019 | $3,338 | $133,500 | $0 | $133,500 |
| 2018 | $3,301 | $131,000 | $0 | $131,000 |
| 2017 | $3,907 | $154,000 | $0 | $154,000 |
| 2016 | $3,606 | $134,500 | $0 | $134,500 |
| 2015 | $3,380 | $114,500 | $0 | $114,500 |
| 2014 | $3,305 | $106,000 | $0 | $106,000 |
Source: Public Records
Map
Nearby Homes
- 45 Province St Unit 1103
- 45 Province St Unit PH2A
- 45 Province St Unit PH2
- 45 Province St Unit 1903
- 45 Province St Unit PH2B
- 1 Franklin St Unit 2310
- 1 Franklin St Unit 5106
- 1 Franklin St Unit 2903
- 1 Franklin St Unit 1003
- 1 Franklin St Unit PH 4B
- 1 Franklin St Unit 4110
- 1 Franklin St Unit 2409
- 1 Franklin St Unit PH 1B
- 1 Franklin St Unit 1709
- 1 Franklin St Unit 1504
- 1 Franklin St Unit 2307
- 1 Franklin St Unit 4508
- 1 Franklin St Unit 1004
- 1 Franklin St Unit PH 4E
- 1 Franklin St Unit 3609
- 333 Washington St Unit 517
- 333 Washington St Unit 503
- 333 Washington St Unit 851
- 333 Washington St Unit 227
- 333 Washington St Unit 225-227
- 333 Washington St Unit 200-1
- 333 Washington St Unit 322-323
- 333 Washington St Unit 543
- 333 Washington St Unit 203-5A
- 333 Washington St Unit 714
- 333 Washington St Unit 207B
- 333 Washington St Unit 622-624
- 333 Washington St Unit 715
- 333 Washington St Unit 638
- 333 Washington St Unit 312
- 333 Washington St Unit 329
- 333 Washington St Unit 850
- 333 Washington St Unit 854
- 333 Washington St Unit 815A
- 333 Washington St Unit 234