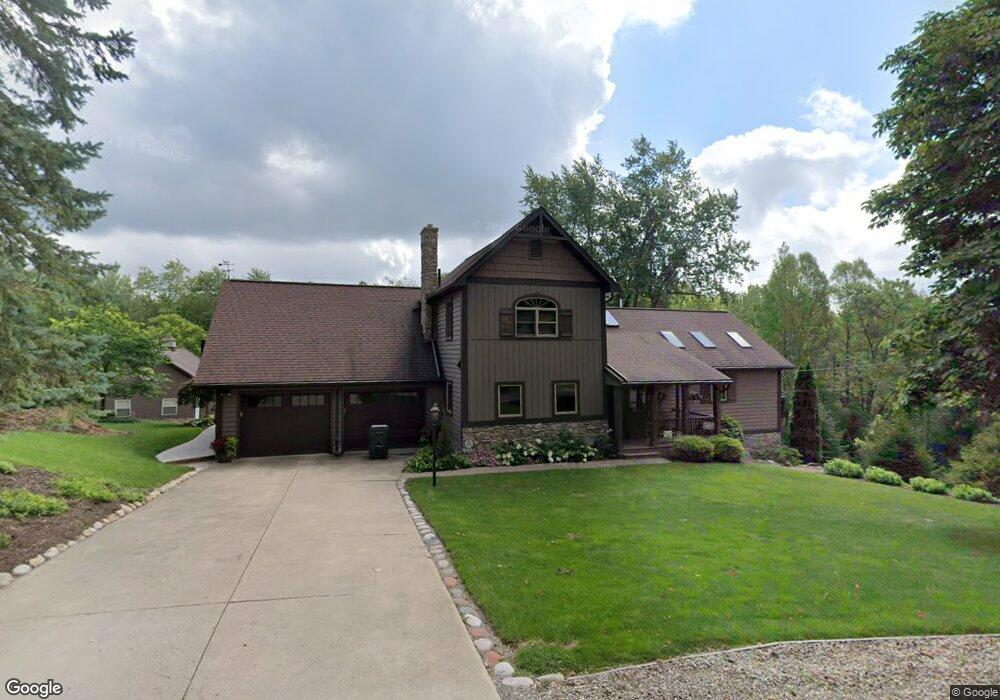
3330 Argyle Rd SE Canton, OH 44707
Estimated Value: $248,000 - $351,598
4
Beds
3
Baths
2,384
Sq Ft
$127/Sq Ft
Est. Value
About This Home
This home is located at 3330 Argyle Rd SE, Canton, OH 44707 and is currently estimated at $303,150, approximately $127 per square foot. 3330 Argyle Rd SE is a home located in Stark County with nearby schools including Faircrest Memorial Elementary School and Canton South High School.
Ownership History
Date
Name
Owned For
Owner Type
Purchase Details
Closed on
May 20, 2005
Sold by
Janson Eric H
Bought by
Janson Darlene R
Current Estimated Value
Purchase Details
Closed on
Sep 19, 2000
Sold by
Norris Victoria M and Nichols Victoria M
Bought by
Janson Eric H
Home Financials for this Owner
Home Financials are based on the most recent Mortgage that was taken out on this home.
Original Mortgage
$140,000
Outstanding Balance
$51,170
Interest Rate
8.14%
Estimated Equity
$251,980
Purchase Details
Closed on
Jun 2, 1994
Sold by
Norris Todd M
Bought by
Norris Victoria M
Home Financials for this Owner
Home Financials are based on the most recent Mortgage that was taken out on this home.
Original Mortgage
$46,000
Interest Rate
8.48%
Mortgage Type
New Conventional
Create a Home Valuation Report for This Property
The Home Valuation Report is an in-depth analysis detailing your home's value as well as a comparison with similar homes in the area
Home Values in the Area
Average Home Value in this Area
Purchase History
| Date | Buyer | Sale Price | Title Company |
|---|---|---|---|
| Janson Darlene R | -- | -- | |
| Janson Eric H | $180,000 | -- | |
| Norris Victoria M | $30,514 | -- |
Source: Public Records
Mortgage History
| Date | Status | Borrower | Loan Amount |
|---|---|---|---|
| Open | Janson Eric H | $140,000 | |
| Previous Owner | Norris Victoria M | $46,000 |
Source: Public Records
Tax History Compared to Growth
Tax History
| Year | Tax Paid | Tax Assessment Tax Assessment Total Assessment is a certain percentage of the fair market value that is determined by local assessors to be the total taxable value of land and additions on the property. | Land | Improvement |
|---|---|---|---|---|
| 2025 | -- | $110,320 | $22,820 | $87,500 |
| 2024 | -- | $110,320 | $22,820 | $87,500 |
| 2023 | $3,581 | $77,290 | $17,610 | $59,680 |
| 2022 | $3,237 | $77,290 | $17,610 | $59,680 |
| 2021 | $3,250 | $77,290 | $17,610 | $59,680 |
| 2020 | $3,048 | $63,710 | $14,950 | $48,760 |
| 2019 | $3,099 | $63,710 | $14,950 | $48,760 |
| 2018 | $3,074 | $63,710 | $14,950 | $48,760 |
| 2017 | $3,149 | $61,620 | $13,030 | $48,590 |
| 2016 | $3,153 | $61,620 | $13,030 | $48,590 |
| 2015 | $2,731 | $53,290 | $13,030 | $40,260 |
| 2014 | $532 | $46,420 | $11,340 | $35,080 |
| 2013 | $1,274 | $46,420 | $11,340 | $35,080 |
Source: Public Records
Map
Nearby Homes
- 3153 Waynesburg Dr SE
- 0000 Sandy Ave SE
- 2802 Trump Ave SE
- 2424 Waynesburg Dr SE
- 2511 Sherr Ave SE
- 5550 Sandy Ave SE
- 5222 Martin Dr SE
- 3025 Orchardview Dr SE
- 1926 Village St SE
- 2122 Millerton St SE
- 711 Nassau St W
- 5346 Shaker Valley Cir SE
- 233 Nassau St W
- 4805 Harvest Cir SE
- 223 Nassau St W
- 225 - 227 Plum St N
- 4624 Ridge Ave SE
- 5333 Dunfred Cir SE
- 5327 Dunfred Cir SE
- 0 Lincoln St SE Unit 5157290
- 3906 Waynesburg Dr SE
- 3858 Waynesburg Dr SE
- 3900 Waynesburg Dr SE
- 3840 Waynesburg Dr SE
- 3950 Waynesburg Dr SE
- 4010 Waynesburg Dr SE
- 3845 Waynesburg Dr SE
- 3820 Waynesburg Dr SE
- 5060 Crestlawn Dr SE
- 5130 Crestlawn Dr SE
- 3951 Waynesburg Dr SE
- 3800 Waynesburg Dr SE
- 4034 Waynesburg Dr SE
- 3811 Waynesburg Dr SE
- 5079 Crestlawn Dr SE
- 5127 Crestlawn Dr SE
- 3244 Argyle Rd SE
- 0 Waynesburg Dr SE Unit 5017806
- 0 Waynesburg Dr SE Unit 5009815
- 0 Waynesburg Dr SE Unit 4430651