
Seller's Agent in 2020
Charlie Leichty
The Property Collective
(419) 722-0848
57 in this area
66 Total Sales
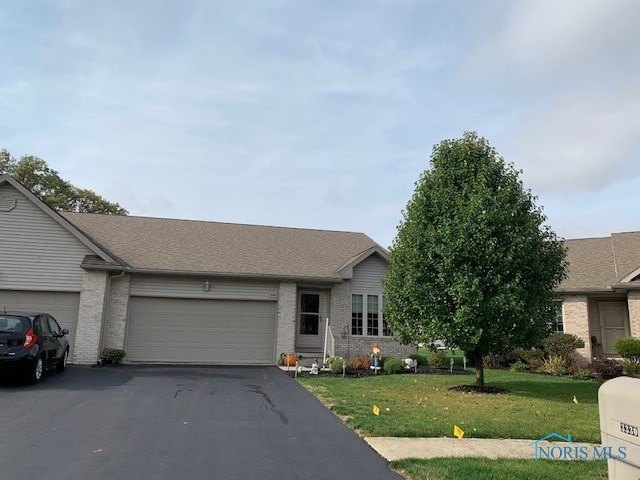
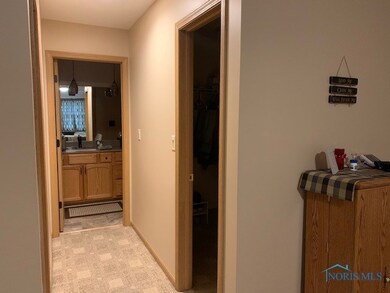

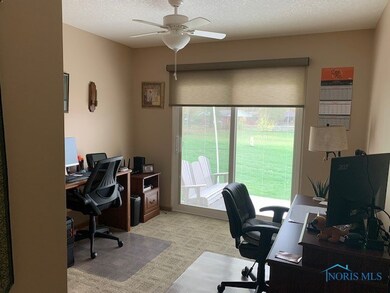
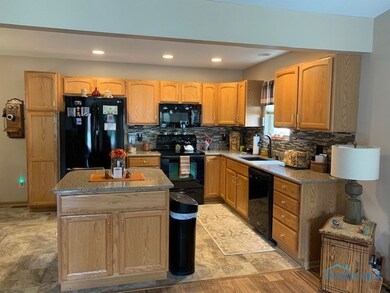

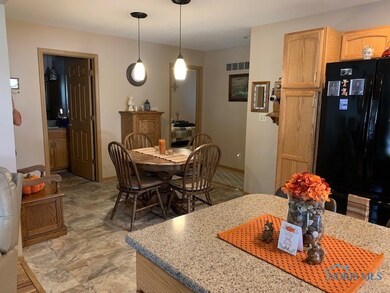
This condo is on a cul de sac in Findlay's Hillcrest Subdivision. Newer flooring in living room, kitchen, laundry and bathrooms. All kitchen appliances will stay. Quartz countertops, sink and backsplash in kitchen. Patio door replaced in 2019, patio was epoxy coated also. This condo has many updates and in excellent condition. This sale is subject to seller finding home of their choice.
Last Agent to Sell the Property
The Property Collective License #0000280455 Listed on: 10/21/2020
| Date | Event | Price | List to Sale | Price per Sq Ft |
|---|---|---|---|---|
| 11/30/2020 11/30/20 | Sold | $190,000 | +1.1% | $126 / Sq Ft |
| 10/28/2020 10/28/20 | Pending | -- | -- | -- |
| 10/21/2020 10/21/20 | For Sale | $188,000 | -- | $124 / Sq Ft |
| Year | Tax Paid | Tax Assessment Tax Assessment Total Assessment is a certain percentage of the fair market value that is determined by local assessors to be the total taxable value of land and additions on the property. | Land | Improvement |
|---|---|---|---|---|
| 2024 | $1,978 | $62,360 | $2,800 | $59,560 |
| 2023 | $1,968 | $62,360 | $2,800 | $59,560 |
| 2022 | $1,969 | $62,360 | $2,800 | $59,560 |
| 2021 | $1,610 | $48,070 | $2,100 | $45,970 |
| 2020 | $1,609 | $48,070 | $2,100 | $45,970 |
| 2019 | $1,361 | $48,070 | $2,100 | $45,970 |
| 2018 | $1,379 | $48,070 | $2,100 | $45,970 |
| 2017 | $692 | $48,070 | $2,100 | $45,970 |
| 2016 | $1,337 | $48,070 | $2,100 | $45,970 |
| 2015 | $1,405 | $48,970 | $2,100 | $46,870 |
| 2014 | $1,390 | $48,360 | $2,100 | $46,260 |
| 2012 | $1,841 | $48,360 | $2,100 | $46,260 |
Seller's Agent in 2020
Charlie Leichty
The Property Collective
(419) 722-0848
57 in this area
66 Total Sales
Buyer's Agent in 2020
Scott Keller
Key Realty, LTD
(419) 722-3341
356 in this area
596 Total Sales
Source: Northwest Ohio Real Estate Information Service (NORIS)
MLS Number: 6061690
APN: 690001020954
Disclaimer: Certain information contained herein is derived from information provided by parties other than Homes.com. All information provided is deemed reliable, but is not guaranteed to be accurate and should be independently verified.
![]() IDX information is provided exclusively for personal, non-commercial use, and may not be used for any purpose other than to identify prospective properties consumers may be interested in purchasing. Information is deemed reliable but not guaranteed. ©2026 NORIS. All rights reserved.
IDX information is provided exclusively for personal, non-commercial use, and may not be used for any purpose other than to identify prospective properties consumers may be interested in purchasing. Information is deemed reliable but not guaranteed. ©2026 NORIS. All rights reserved.
Ask me questions while you tour the home.