33303 2735 North Ave La Moille, IL 61330
Estimated Value: $153,000 - $191,000
4
Beds
1
Bath
1,956
Sq Ft
$87/Sq Ft
Est. Value
About This Home
This home is located at 33303 2735 North Ave, La Moille, IL 61330 and is currently estimated at $169,381, approximately $86 per square foot. 33303 2735 North Ave is a home located in Bureau County with nearby schools including Northbrook School, Blackstone Elementary School, and Lincoln Elementary School.
Ownership History
Date
Name
Owned For
Owner Type
Purchase Details
Closed on
Jan 20, 2006
Sold by
Emc Mortgage Corp
Bought by
Radomski Tiffany E and Radomski Jeffrey R
Current Estimated Value
Home Financials for this Owner
Home Financials are based on the most recent Mortgage that was taken out on this home.
Original Mortgage
$100,000
Outstanding Balance
$56,440
Interest Rate
6.34%
Mortgage Type
New Conventional
Estimated Equity
$112,941
Create a Home Valuation Report for This Property
The Home Valuation Report is an in-depth analysis detailing your home's value as well as a comparison with similar homes in the area
Home Values in the Area
Average Home Value in this Area
Purchase History
| Date | Buyer | Sale Price | Title Company |
|---|---|---|---|
| Radomski Tiffany E | $100,000 | None Available |
Source: Public Records
Mortgage History
| Date | Status | Borrower | Loan Amount |
|---|---|---|---|
| Open | Radomski Tiffany E | $100,000 |
Source: Public Records
Tax History Compared to Growth
Tax History
| Year | Tax Paid | Tax Assessment Tax Assessment Total Assessment is a certain percentage of the fair market value that is determined by local assessors to be the total taxable value of land and additions on the property. | Land | Improvement |
|---|---|---|---|---|
| 2024 | $2,267 | $42,122 | $4,281 | $37,841 |
| 2023 | $2,267 | $39,238 | $3,988 | $35,250 |
| 2022 | $2,100 | $36,463 | $3,706 | $32,757 |
| 2021 | $1,945 | $33,650 | $3,420 | $30,230 |
| 2020 | $1,907 | $33,205 | $3,375 | $29,830 |
| 2019 | $1,907 | $32,586 | $3,312 | $29,274 |
| 2018 | $1,737 | $30,972 | $3,148 | $27,824 |
| 2017 | $1,818 | $30,275 | $3,077 | $27,198 |
| 2016 | $1,771 | $29,313 | $2,979 | $26,334 |
| 2015 | -- | $28,246 | $2,870 | $25,376 |
| 2014 | -- | $27,246 | $2,870 | $24,376 |
| 2013 | -- | $27,916 | $2,941 | $24,975 |
Source: Public Records
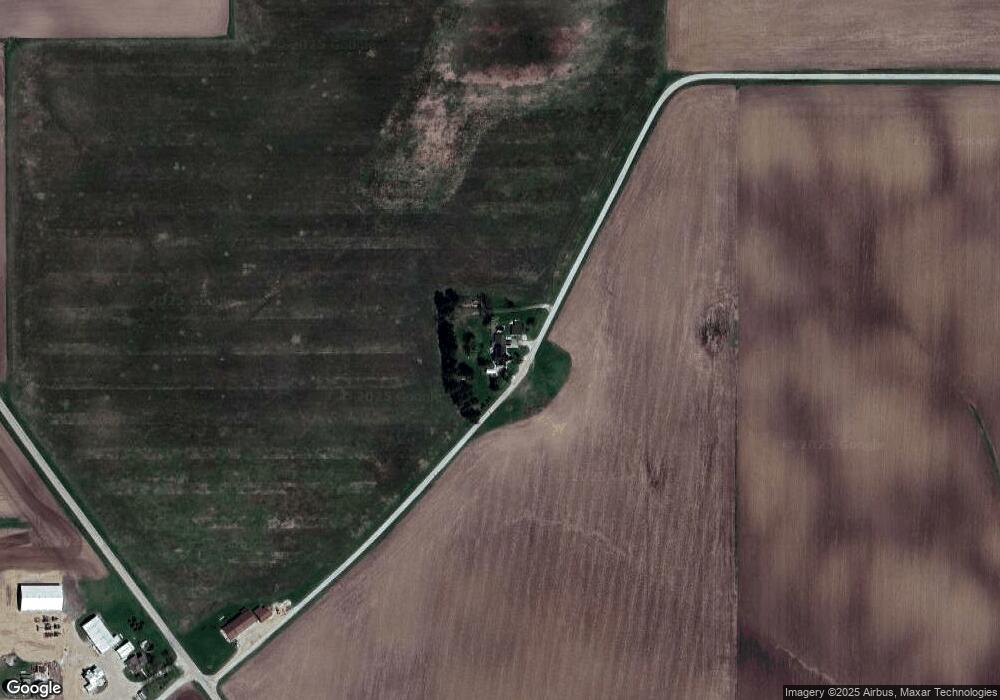
Map
Nearby Homes