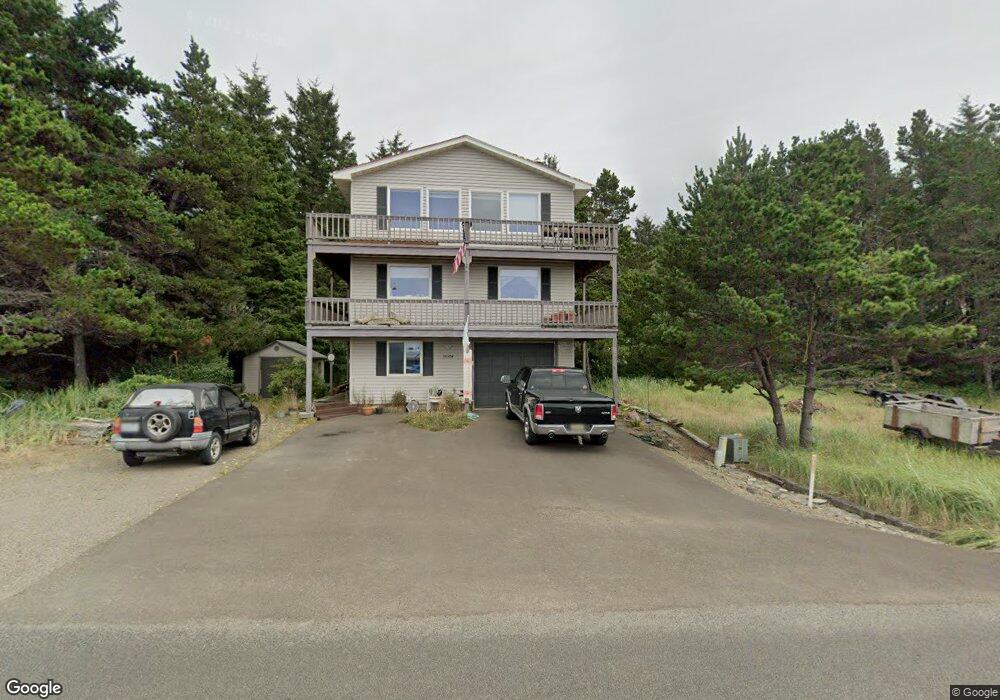
33304 J Place Ocean Park, WA 98640
Estimated Value: $400,000 - $523,000
3
Beds
3
Baths
1,800
Sq Ft
$264/Sq Ft
Est. Value
About This Home
This home is located at 33304 J Place, Ocean Park, WA 98640 and is currently estimated at $475,125, approximately $263 per square foot. 33304 J Place is a home located in Pacific County with nearby schools including Ilwaco Senior High School.
Ownership History
Date
Name
Owned For
Owner Type
Purchase Details
Closed on
Feb 10, 2015
Sold by
Minich Ric
Bought by
Minich Richard and Minich Phyllis
Current Estimated Value
Purchase Details
Closed on
Jan 25, 2013
Sold by
Berlien Michael J and Wells Fargo Bank Na
Bought by
Minich Ric
Purchase Details
Closed on
Sep 1, 2009
Sold by
Hirst Mary Ann
Bought by
Berlien Michael J
Home Financials for this Owner
Home Financials are based on the most recent Mortgage that was taken out on this home.
Original Mortgage
$208,000
Interest Rate
5.19%
Create a Home Valuation Report for This Property
The Home Valuation Report is an in-depth analysis detailing your home's value as well as a comparison with similar homes in the area
Home Values in the Area
Average Home Value in this Area
Purchase History
| Date | Buyer | Sale Price | Title Company |
|---|---|---|---|
| Minich Richard | -- | None Available | |
| Minich Ric | $123,000 | None Available | |
| Berlien Michael J | $260,000 | Pacific County Title Co |
Source: Public Records
Mortgage History
| Date | Status | Borrower | Loan Amount |
|---|---|---|---|
| Previous Owner | Berlien Michael J | $208,000 |
Source: Public Records
Tax History Compared to Growth
Tax History
| Year | Tax Paid | Tax Assessment Tax Assessment Total Assessment is a certain percentage of the fair market value that is determined by local assessors to be the total taxable value of land and additions on the property. | Land | Improvement |
|---|---|---|---|---|
| 2025 | $2,917 | $424,800 | $147,000 | $277,800 |
| 2024 | $2,917 | $404,600 | $140,000 | $264,600 |
| 2023 | $3,152 | $399,600 | $110,000 | $289,600 |
| 2022 | $3,120 | $287,000 | $77,000 | $210,000 |
| 2021 | $3,037 | $257,100 | $66,000 | $191,100 |
| 2020 | $3,059 | $239,800 | $66,000 | $173,800 |
| 2019 | $2,821 | $219,800 | $60,500 | $159,300 |
| 2018 | $2,830 | $180,500 | $63,000 | $117,500 |
| 2017 | $2,522 | $180,500 | $63,000 | $117,500 |
| 2015 | $2,725 | $200,600 | $70,000 | $130,600 |
| 2014 | -- | $194,100 | $70,000 | $124,100 |
| 2012 | -- | $207,800 | $70,000 | $137,800 |
Source: Public Records
Map
Nearby Homes