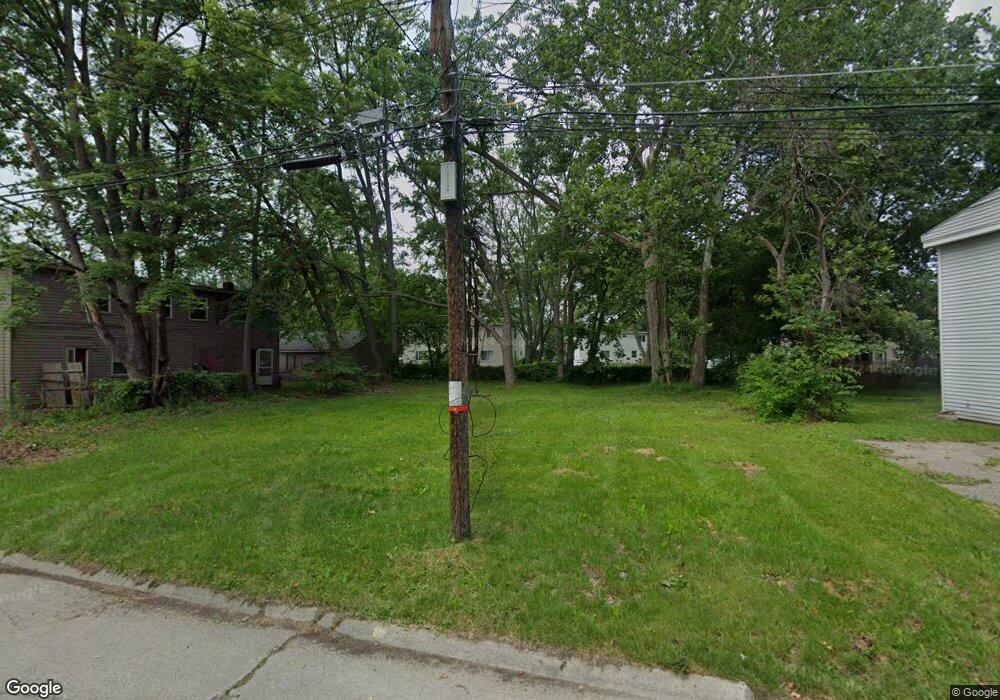
33307 Belding Ct Westland, MI 48186
Estimated Value: $148,257 - $386,000
3
Beds
1
Bath
2,108
Sq Ft
$126/Sq Ft
Est. Value
About This Home
This home is located at 33307 Belding Ct, Westland, MI 48186 and is currently estimated at $265,814, approximately $126 per square foot. 33307 Belding Ct is a home located in Wayne County with nearby schools including Alexander Hamilton Elementary School, Adams Middle School, and Benjamin Franklin Middle School.
Ownership History
Date
Name
Owned For
Owner Type
Purchase Details
Closed on
Sep 1, 2016
Sold by
Wayne County Treasurer
Bought by
Treasurer City Of Westland
Current Estimated Value
Purchase Details
Closed on
Mar 31, 2005
Sold by
Mavi Avtar S and Mavi Gurjeet K
Bought by
Mavi Corp
Purchase Details
Closed on
Sep 10, 2003
Sold by
Home Sweet Home Rental Co
Bought by
Gardner Nicole
Home Financials for this Owner
Home Financials are based on the most recent Mortgage that was taken out on this home.
Original Mortgage
$66,050
Interest Rate
6.04%
Mortgage Type
Purchase Money Mortgage
Purchase Details
Closed on
May 22, 2001
Sold by
Gardner Mark V
Bought by
Home Sweet Home Rental Co
Purchase Details
Closed on
Dec 11, 2000
Sold by
City Of Westland
Bought by
Home Sweet Home Rental Co
Purchase Details
Closed on
Dec 29, 1999
Sold by
Stempien Lorraine
Bought by
Home Sweet Home Rental Co
Create a Home Valuation Report for This Property
The Home Valuation Report is an in-depth analysis detailing your home's value as well as a comparison with similar homes in the area
Home Values in the Area
Average Home Value in this Area
Purchase History
| Date | Buyer | Sale Price | Title Company |
|---|---|---|---|
| Treasurer City Of Westland | $3,078 | None Available | |
| Mavi Corp | -- | Tri County Title Agency Inc | |
| Mavi Avtar S | -- | Tri County Title Agency Inc | |
| Gardner Nicole | -- | -- | |
| Home Sweet Home Rental Co | -- | -- | |
| Home Sweet Home Rental Co | $17,376 | -- | |
| Home Sweet Home Rental Co | -- | -- |
Source: Public Records
Mortgage History
| Date | Status | Borrower | Loan Amount |
|---|---|---|---|
| Previous Owner | Gardner Nicole | $66,050 |
Source: Public Records
Tax History Compared to Growth
Tax History
| Year | Tax Paid | Tax Assessment Tax Assessment Total Assessment is a certain percentage of the fair market value that is determined by local assessors to be the total taxable value of land and additions on the property. | Land | Improvement |
|---|---|---|---|---|
| 2025 | -- | $0 | $0 | $0 |
| 2024 | -- | $0 | $0 | $0 |
| 2023 | $0 | $0 | $0 | $0 |
| 2022 | $0 | $0 | $0 | $0 |
| 2021 | $0 | $0 | $0 | $0 |
| 2019 | $0 | $0 | $0 | $0 |
| 2018 | $2,196 | $0 | $0 | $0 |
| 2017 | $120 | $0 | $0 | $0 |
| 2016 | $3,035 | $15,100 | $0 | $0 |
| 2015 | $1,328 | $13,540 | $0 | $0 |
| 2013 | $1,644 | $17,130 | $0 | $0 |
| 2012 | $1,720 | $20,480 | $0 | $0 |
Source: Public Records
Map
Nearby Homes
- 33436 Bendon Ct
- 33431 Bendon Ct
- 33411 Bentley Ct
- 33012 Akron St
- 2641 Cascade Ct
- 2075 Alanson St
- 2119 Emerson St
- 33824 Casco Ct
- 2204 Ellsworth St
- 32604 Montmorency St
- 34113 Caspian Ct
- 2335 Deerfield Ct
- 34038 Caseville Ct
- 2307 Deerfield Ct
- 32462 Muskegon Ct
- 2340 Deerfield Ct
- 0000 Barrington Ave
- 2316 Deerfield Ct
- 33206 Barrington St
- 2017 Eastport St
- 33303 Belding Ct
- 33311 Belding Ct
- 33385 Belding Ct
- 0 Belding Ct
- 33389 Belding Ct
- 33381 Belding Ct
- 33315 Belding Ct
- 33304 Belding Ct
- 33308 Belding Ct
- 33377 Belding Ct
- 33312 Belding Ct
- 2504 Bannister St
- 33405 Bendon Ct
- 33319 Belding Ct
- 2505 Bannister St
- 33386 Belding Ct
- 33373 Belding Ct
- 33390 Belding Ct
- 33382 Belding Ct
- 2506 Bannister St