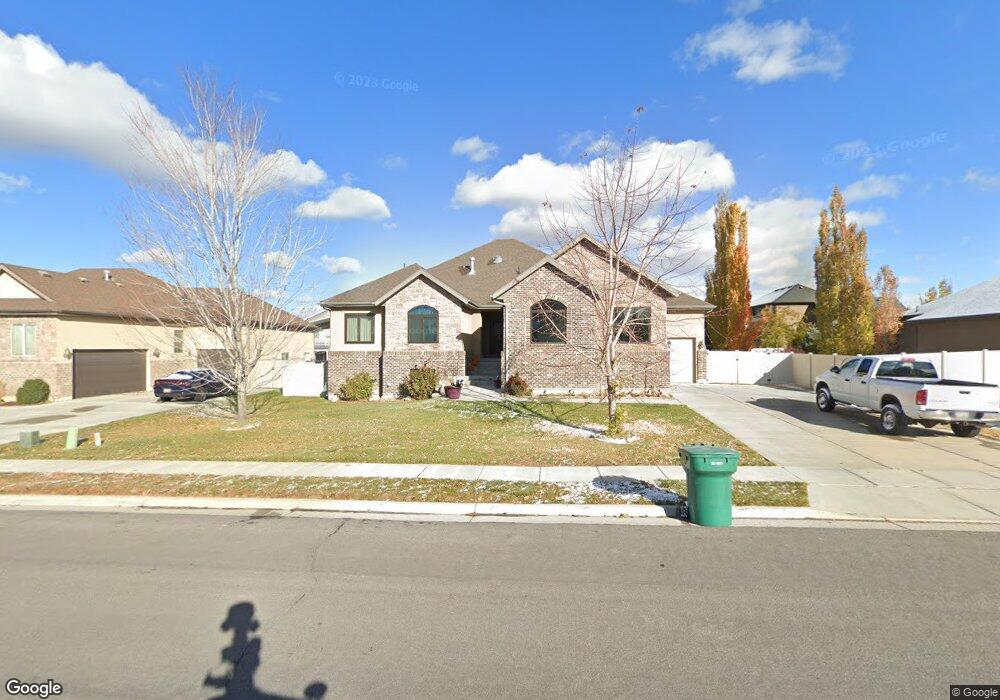
3332 W 200 N Layton, UT 84041
Estimated Value: $647,000 - $768,000
4
Beds
2
Baths
4,433
Sq Ft
$163/Sq Ft
Est. Value
About This Home
This home is located at 3332 W 200 N, Layton, UT 84041 and is currently estimated at $723,124, approximately $163 per square foot. 3332 W 200 N is a home located in Davis County with nearby schools including Sand Springs Elementary School, Legacy Junior High School, and Layton High School.
Ownership History
Date
Name
Owned For
Owner Type
Purchase Details
Closed on
Oct 23, 2009
Sold by
Utah Rei Inc
Bought by
Pierpont Scott M and Pierpont Rebecca Sue Cate
Current Estimated Value
Home Financials for this Owner
Home Financials are based on the most recent Mortgage that was taken out on this home.
Original Mortgage
$160,000
Outstanding Balance
$104,958
Interest Rate
5.25%
Mortgage Type
Purchase Money Mortgage
Estimated Equity
$618,166
Purchase Details
Closed on
Sep 22, 2009
Sold by
Daines Karl Erik
Bought by
Utah Rei Inc
Home Financials for this Owner
Home Financials are based on the most recent Mortgage that was taken out on this home.
Original Mortgage
$160,000
Outstanding Balance
$104,958
Interest Rate
5.25%
Mortgage Type
Purchase Money Mortgage
Estimated Equity
$618,166
Purchase Details
Closed on
Mar 29, 2007
Sold by
Wight Inc
Bought by
Daines Karl Erik
Create a Home Valuation Report for This Property
The Home Valuation Report is an in-depth analysis detailing your home's value as well as a comparison with similar homes in the area
Home Values in the Area
Average Home Value in this Area
Purchase History
| Date | Buyer | Sale Price | Title Company |
|---|---|---|---|
| Pierpont Scott M | -- | Utah Commercial Title | |
| Utah Rei Inc | $239,000 | None Available | |
| Daines Karl Erik | -- | Bonneville Superior Title Co |
Source: Public Records
Mortgage History
| Date | Status | Borrower | Loan Amount |
|---|---|---|---|
| Open | Utah Rei Inc | $160,000 |
Source: Public Records
Tax History Compared to Growth
Tax History
| Year | Tax Paid | Tax Assessment Tax Assessment Total Assessment is a certain percentage of the fair market value that is determined by local assessors to be the total taxable value of land and additions on the property. | Land | Improvement |
|---|---|---|---|---|
| 2025 | $3,668 | $385,000 | $126,202 | $258,798 |
| 2024 | $3,485 | $368,500 | $136,260 | $232,240 |
| 2023 | $3,412 | $636,000 | $141,605 | $494,395 |
| 2022 | $3,603 | $364,650 | $83,995 | $280,655 |
| 2021 | $3,306 | $499,000 | $125,987 | $373,013 |
| 2020 | $3,004 | $435,000 | $107,199 | $327,801 |
| 2019 | $2,919 | $414,000 | $107,080 | $306,920 |
| 2018 | $2,711 | $386,000 | $94,237 | $291,763 |
| 2016 | $2,651 | $194,700 | $38,515 | $156,185 |
| 2015 | $2,428 | $169,345 | $38,515 | $130,830 |
| 2014 | $2,127 | $151,652 | $38,515 | $113,137 |
| 2013 | -- | $154,508 | $39,709 | $114,799 |
Source: Public Records
Map
Nearby Homes
- 454 N 3550 W
- 101 S 3600 W
- 567 W 3575 S
- 697 N 3275 W
- 3169 S 550 W
- 245 S Summer Breeze Ln
- 3583 W 200 S
- 3535 W Overlook Dr
- 2794 W Gentile St
- 3263 W 850 N
- 2674 S 75 E
- 967 W Yamada Ct
- 3391 W 1125 N
- 2681 S 200 E
- 818 N 2625 W
- 803 W 2800 S
- 162 E 2600 S
- 2601 S 200 E
- 2875 N Hill Rd Unit 199
- 2875 N Hill Rd Unit 27