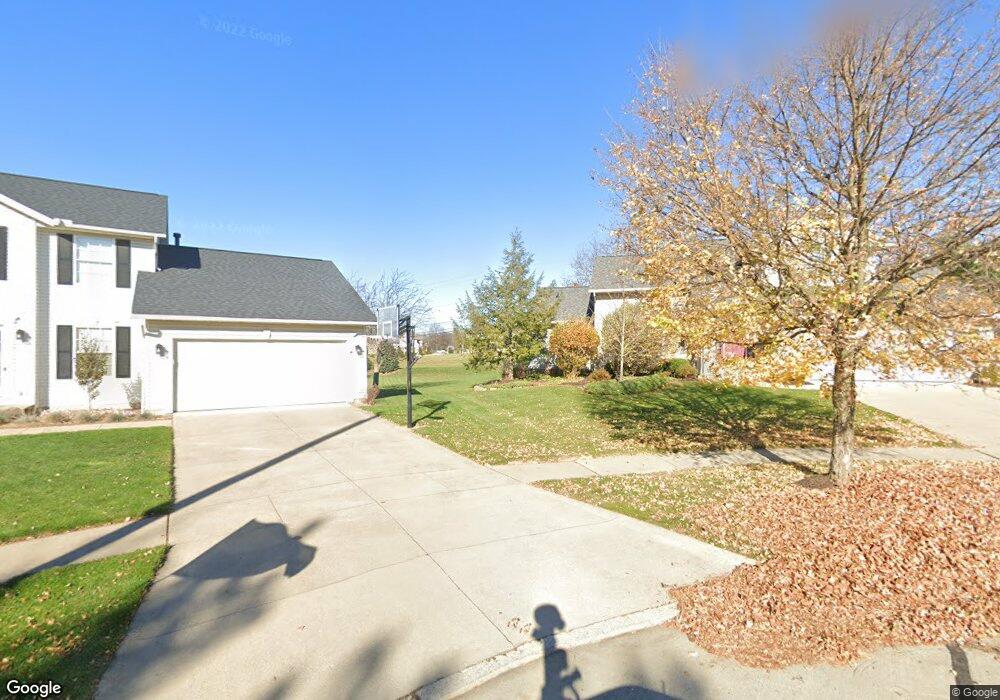
3333 Colton Ct Wooster, OH 44691
Estimated Value: $382,259 - $414,000
3
Beds
3
Baths
2,100
Sq Ft
$190/Sq Ft
Est. Value
About This Home
This home is located at 3333 Colton Ct, Wooster, OH 44691 and is currently estimated at $399,315, approximately $190 per square foot. 3333 Colton Ct is a home located in Wayne County with nearby schools including Melrose Elementary School, Edgewood Middle School, and Wooster High School.
Ownership History
Date
Name
Owned For
Owner Type
Purchase Details
Closed on
Mar 21, 2005
Sold by
Spelman Jeffrey B and Spelman Joanna L
Bought by
Streblo Cindi L
Current Estimated Value
Home Financials for this Owner
Home Financials are based on the most recent Mortgage that was taken out on this home.
Original Mortgage
$163,200
Outstanding Balance
$83,067
Interest Rate
5.67%
Mortgage Type
Unknown
Estimated Equity
$316,248
Purchase Details
Closed on
Mar 17, 2000
Sold by
Ward Lycurgus B
Bought by
Spelman Jeffrey B and Spelman Joanna L
Purchase Details
Closed on
Aug 31, 1999
Sold by
W W M H Ltd
Bought by
Ward Lycurgus B and Ward Staci L
Home Financials for this Owner
Home Financials are based on the most recent Mortgage that was taken out on this home.
Original Mortgage
$142,400
Interest Rate
7.61%
Mortgage Type
New Conventional
Create a Home Valuation Report for This Property
The Home Valuation Report is an in-depth analysis detailing your home's value as well as a comparison with similar homes in the area
Home Values in the Area
Average Home Value in this Area
Purchase History
| Date | Buyer | Sale Price | Title Company |
|---|---|---|---|
| Streblo Cindi L | $192,000 | Service 1St Title Agcy | |
| Spelman Jeffrey B | $180,000 | -- | |
| Ward Lycurgus B | $178,000 | -- |
Source: Public Records
Mortgage History
| Date | Status | Borrower | Loan Amount |
|---|---|---|---|
| Open | Streblo Cindi L | $163,200 | |
| Previous Owner | Ward Lycurgus B | $142,400 | |
| Closed | Spelman Jeffrey B | -- |
Source: Public Records
Tax History Compared to Growth
Tax History
| Year | Tax Paid | Tax Assessment Tax Assessment Total Assessment is a certain percentage of the fair market value that is determined by local assessors to be the total taxable value of land and additions on the property. | Land | Improvement |
|---|---|---|---|---|
| 2024 | $4,723 | $113,920 | $19,260 | $94,660 |
| 2023 | $4,723 | $113,920 | $19,260 | $94,660 |
| 2022 | $4,206 | $80,790 | $13,660 | $67,130 |
| 2021 | $4,479 | $80,790 | $13,660 | $67,130 |
| 2020 | $4,253 | $80,790 | $13,660 | $67,130 |
| 2019 | $4,136 | $75,380 | $13,660 | $61,720 |
| 2018 | $4,148 | $75,380 | $13,660 | $61,720 |
| 2017 | $4,124 | $75,380 | $13,660 | $61,720 |
| 2016 | $4,299 | $72,440 | $13,660 | $58,780 |
| 2015 | $4,223 | $72,440 | $13,660 | $58,780 |
| 2014 | $4,225 | $72,440 | $13,660 | $58,780 |
| 2013 | $4,190 | $71,070 | $12,570 | $58,500 |
Source: Public Records
Map
Nearby Homes
- 1315 E Milltown Rd
- 3271 Bayberry Cove
- 1495 Summerlin Dr
- 3569 Cleveland Rd
- 1425 Hickory Ln
- 2782 Tanglewood Dr
- 2667 Estate Dr
- 0 Winkler Dr
- 751 Greenwood Blvd
- 4157 Fieldridge Ct
- 4400 Melrose Dr Unit 288
- 2530 Portage Grove Ct
- V/L 6838 Forest Creek Dr
- 594 Forest Creek Dr
- 458 Mather Hill Dr
- 471 Mather Hill Dr
- 539 Forest Creek Dr Unit 6842
- 3393 Friendsville Rd
- 437 Mather Hill Dr
- 3377 Friendsville Rd
- 3335 Colton Ct
- 3325 Colton Ct
- 3336 Colton Ct
- 3317 Colton Ct
- 600 Wildwood Dr
- 616 Wildwood Dr
- 3322 Colton Ct
- 3332 Colton Ct
- 3309 Colton Ct
- 3409 Pecan Ln
- 638 Wildwood Dr
- 3411 Pecan Ln
- 1400 E Milltown Rd
- 3413 Pecan Ln
- 664 Wildwood Dr
- 3417 Pecan Ln
- 3419 Pecan Ln
- 682 Wildwood Dr
- 3294 Colton Ct
- 3421 Pecan Ln