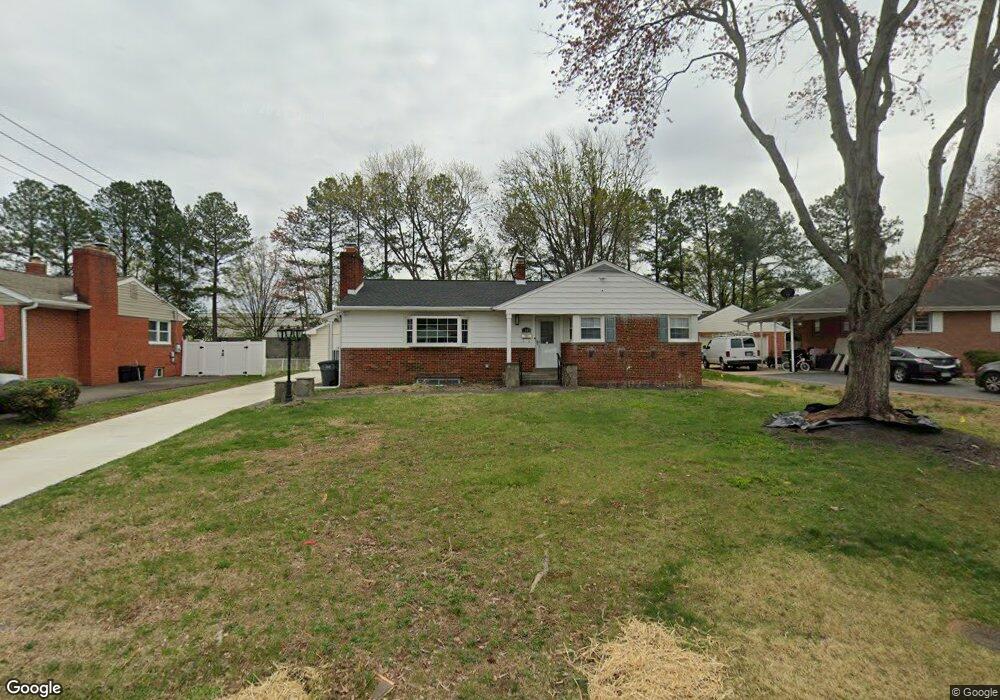
3333 Kaywood Dr Falls Church, VA 22041
Estimated Value: $683,000 - $896,000
3
Beds
2
Baths
1,638
Sq Ft
$497/Sq Ft
Est. Value
About This Home
This home is located at 3333 Kaywood Dr, Falls Church, VA 22041 and is currently estimated at $814,799, approximately $497 per square foot. 3333 Kaywood Dr is a home located in Fairfax County with nearby schools including Glasgow Middle School, Justice High School, and St. Anthony of Padua School.
Ownership History
Date
Name
Owned For
Owner Type
Purchase Details
Closed on
Jan 12, 2024
Sold by
Bagga Anil K
Bought by
Bagga Anil K and Arora Shilpa
Current Estimated Value
Purchase Details
Closed on
May 14, 1999
Sold by
Chaudhry Maqsood A
Bought by
Bagga Anil K
Home Financials for this Owner
Home Financials are based on the most recent Mortgage that was taken out on this home.
Original Mortgage
$198,550
Interest Rate
6.92%
Purchase Details
Closed on
Nov 6, 1998
Sold by
F N M A
Bought by
Chaudhry Magsood A
Purchase Details
Closed on
Jul 26, 1995
Sold by
Webster Gene
Bought by
Skinarakis Athanasios G
Home Financials for this Owner
Home Financials are based on the most recent Mortgage that was taken out on this home.
Original Mortgage
$168,500
Interest Rate
7.56%
Create a Home Valuation Report for This Property
The Home Valuation Report is an in-depth analysis detailing your home's value as well as a comparison with similar homes in the area
Home Values in the Area
Average Home Value in this Area
Purchase History
| Date | Buyer | Sale Price | Title Company |
|---|---|---|---|
| Bagga Anil K | -- | None Listed On Document | |
| Bagga Anil K | -- | None Listed On Document | |
| Bagga Anil K | $209,000 | -- | |
| Chaudhry Magsood A | $180,000 | -- | |
| Skinarakis Athanasios G | $198,500 | -- |
Source: Public Records
Mortgage History
| Date | Status | Borrower | Loan Amount |
|---|---|---|---|
| Previous Owner | Bagga Anil K | $198,550 | |
| Previous Owner | Skinarakis Athanasios G | $168,500 |
Source: Public Records
Tax History Compared to Growth
Tax History
| Year | Tax Paid | Tax Assessment Tax Assessment Total Assessment is a certain percentage of the fair market value that is determined by local assessors to be the total taxable value of land and additions on the property. | Land | Improvement |
|---|---|---|---|---|
| 2025 | $9,741 | $852,120 | $391,000 | $461,120 |
| 2024 | $9,741 | $780,160 | $341,000 | $439,160 |
| 2023 | $9,286 | $771,230 | $341,000 | $430,230 |
| 2022 | $7,923 | $692,910 | $306,000 | $386,910 |
| 2021 | $7,021 | $558,500 | $271,000 | $287,500 |
| 2020 | $6,943 | $549,830 | $266,000 | $283,830 |
| 2019 | $6,815 | $537,830 | $254,000 | $283,830 |
| 2018 | $5,835 | $507,390 | $247,000 | $260,390 |
| 2017 | $6,114 | $491,390 | $231,000 | $260,390 |
| 2016 | $6,053 | $486,390 | $226,000 | $260,390 |
| 2015 | $5,565 | $461,550 | $213,000 | $248,550 |
| 2014 | $5,310 | $439,990 | $201,000 | $238,990 |
Source: Public Records
Map
Nearby Homes
- 3444 Washington Dr
- 5936 Munson Ct
- 526 S Carlin Springs Rd
- 3391 Lakeside View Dr Unit 20-5
- 5565 Columbia Pike Unit 412
- 3345 Lakeside View Dr Unit 7-7
- 3504 Pinetree Terrace
- 3721 Munson Rd
- 818 S Greenbrier St
- 3100 S Manchester St Unit 442
- 3100 S Manchester St Unit 909
- 3100 S Manchester St Unit 813
- 801 S Greenbrier St Unit 304
- 801 S Greenbrier St Unit 412
- 6057 Brook Dr
- 5817 2nd St S
- 5815 2nd St S
- 641 S Greenbrier St
- 6065 Munson Hill Rd
- 16 S Manchester St Unit 8
- 3331 Kaywood Dr
- 3335 Kaywood Dr
- 3329 Kaywood Dr
- 3337 Kaywood Dr
- 3318 Longwood Dr
- 3332 Kaywood Dr
- 3327 Kaywood Dr
- 3400 Payne St
- 3336 Kaywood Dr
- 3334 Kaywood Dr
- 3325 Kaywood Dr
- 3326 Kaywood Dr
- 3316 Longwood Dr
- 5872 Leesburg Pike
- 5874 Leesburg Pike
- 3409 Payne St
- 5870 Leesburg Pike
- 3323 Kaywood Dr
- 5859 Glen Forest Dr
- 3315 Longwood Dr