Estimated Value: $124,000 - $232,000
3
Beds
1
Bath
1,588
Sq Ft
$111/Sq Ft
Est. Value
About This Home
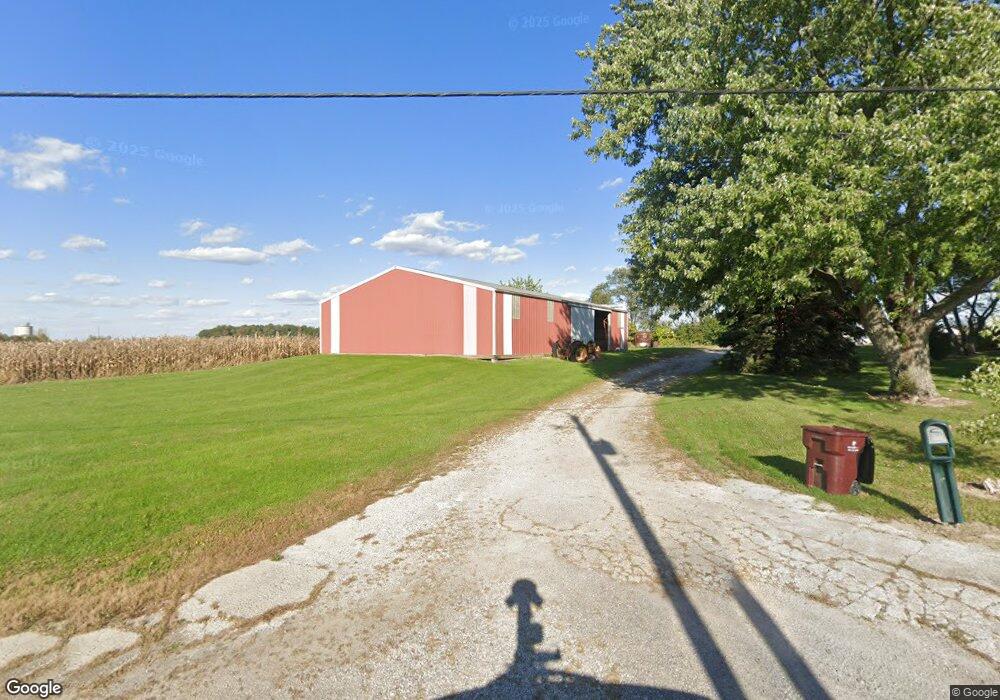
This home is located at 3333 Yoder Rd, Lima, OH 45806 and is currently estimated at $176,712, approximately $111 per square foot. 3333 Yoder Rd is a home located in Allen County with nearby schools including Perry Elementary School, Perry High School, and Auglaize County Educational Academy.
Ownership History
Date
Name
Owned For
Owner Type
Purchase Details
Closed on
Feb 24, 2020
Sold by
Lyle Theodore and Lyle Jeanne
Bought by
Lyle Matthew P and Lyle Karla R
Current Estimated Value
Home Financials for this Owner
Home Financials are based on the most recent Mortgage that was taken out on this home.
Original Mortgage
$90,900
Outstanding Balance
$72,015
Interest Rate
3.6%
Mortgage Type
Unknown
Estimated Equity
$104,697
Purchase Details
Closed on
Apr 22, 2011
Sold by
Lyle Jeanne and Jeanne Haning M
Bought by
Lyle Theodore and Lyle Jeanne
Home Financials for this Owner
Home Financials are based on the most recent Mortgage that was taken out on this home.
Original Mortgage
$103,171
Interest Rate
5.5%
Mortgage Type
FHA
Purchase Details
Closed on
Oct 28, 1994
Sold by
Burgess John
Bought by
Haning M Jeanne
Home Financials for this Owner
Home Financials are based on the most recent Mortgage that was taken out on this home.
Original Mortgage
$57,500
Interest Rate
8.68%
Mortgage Type
New Conventional
Create a Home Valuation Report for This Property
The Home Valuation Report is an in-depth analysis detailing your home's value as well as a comparison with similar homes in the area
Purchase History
| Date | Buyer | Sale Price | Title Company |
|---|---|---|---|
| Lyle Matthew P | -- | None Available | |
| Lyle Theodore | -- | Attorney | |
| Haning M Jeanne | $82,000 | -- |
Source: Public Records
Mortgage History
| Date | Status | Borrower | Loan Amount |
|---|---|---|---|
| Open | Lyle Matthew P | $90,900 | |
| Closed | Lyle Theodore | $103,171 | |
| Closed | Haning M Jeanne | $57,500 |
Source: Public Records
Tax History
| Year | Tax Paid | Tax Assessment Tax Assessment Total Assessment is a certain percentage of the fair market value that is determined by local assessors to be the total taxable value of land and additions on the property. | Land | Improvement |
|---|---|---|---|---|
| 2024 | $1,774 | $46,620 | $7,280 | $39,340 |
| 2023 | $1,630 | $38,860 | $6,060 | $32,800 |
| 2022 | $1,650 | $38,860 | $6,060 | $32,800 |
| 2021 | $1,638 | $38,860 | $6,060 | $32,800 |
| 2020 | $1,521 | $33,330 | $5,500 | $27,830 |
| 2019 | $1,521 | $33,330 | $5,500 | $27,830 |
| 2018 | $1,479 | $33,330 | $5,500 | $27,830 |
| 2017 | $1,394 | $30,910 | $5,500 | $25,410 |
| 2016 | $1,393 | $30,910 | $5,500 | $25,410 |
| 2015 | $1,268 | $30,910 | $5,500 | $25,410 |
| 2014 | $1,268 | $27,450 | $5,500 | $21,950 |
| 2013 | $1,400 | $27,450 | $5,500 | $21,950 |
Source: Public Records
Map
Nearby Homes
- 1200 E Breese Rd
- 3700 Greely Chapel Rd
- 3828 Saint Johns Rd
- 2500 Greely Chapel Rd
- 0 Harding Hwy Unit 307187
- 0 Harding Hwy Unit 19317256
- 0 E 13th St
- 1803 Saint Johns Rd
- St Johns Rd
- 00 E 12th St
- 0000 E 13th St
- 000 E 13th St
- 000 E 12th St
- 0 E 12th St
- 106 E 13th St
- 122 E 12th St
- 865 E 4th St
- 640 E 4th St
- 1411 Reese Ave
- 639 E 4th St
Your Personal Tour Guide
Ask me questions while you tour the home.