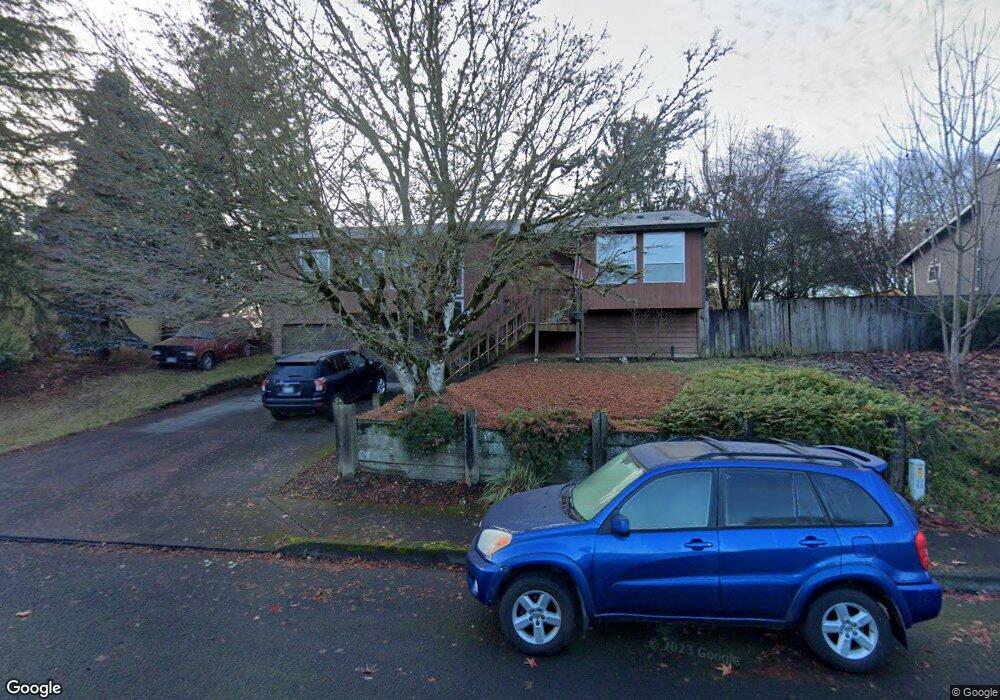
33332 SW Rogers Rd Scappoose, OR 97056
Estimated Value: $497,000 - $539,000
4
Beds
3
Baths
2,253
Sq Ft
$228/Sq Ft
Est. Value
About This Home
This home is located at 33332 SW Rogers Rd, Scappoose, OR 97056 and is currently estimated at $513,370, approximately $227 per square foot. 33332 SW Rogers Rd is a home located in Columbia County with nearby schools including Scappoose High School, South Columbia Family School, and Scappoose Adventist School.
Ownership History
Date
Name
Owned For
Owner Type
Purchase Details
Closed on
Feb 20, 2013
Sold by
Carnahan James M and Carnahan Stacy R
Bought by
Nickel Brian K and Nickel Kimberly A
Current Estimated Value
Home Financials for this Owner
Home Financials are based on the most recent Mortgage that was taken out on this home.
Original Mortgage
$183,673
Outstanding Balance
$127,981
Interest Rate
3.34%
Mortgage Type
New Conventional
Estimated Equity
$385,389
Purchase Details
Closed on
Mar 29, 2005
Sold by
Gringauz Arkady S and Gringauz Margaret L
Bought by
Carnahan James M and Carnahan Stacy R
Create a Home Valuation Report for This Property
The Home Valuation Report is an in-depth analysis detailing your home's value as well as a comparison with similar homes in the area
Home Values in the Area
Average Home Value in this Area
Purchase History
| Date | Buyer | Sale Price | Title Company |
|---|---|---|---|
| Nickel Brian K | $180,000 | Multiple | |
| Carnahan James M | $205,000 | Ticor Title |
Source: Public Records
Mortgage History
| Date | Status | Borrower | Loan Amount |
|---|---|---|---|
| Open | Nickel Brian K | $183,673 |
Source: Public Records
Tax History Compared to Growth
Tax History
| Year | Tax Paid | Tax Assessment Tax Assessment Total Assessment is a certain percentage of the fair market value that is determined by local assessors to be the total taxable value of land and additions on the property. | Land | Improvement |
|---|---|---|---|---|
| 2024 | $4,599 | $278,900 | $97,350 | $181,550 |
| 2023 | $4,556 | $270,780 | $91,610 | $179,170 |
| 2022 | $4,364 | $262,900 | $88,310 | $174,590 |
| 2021 | $4,239 | $255,250 | $97,570 | $157,680 |
| 2020 | $3,932 | $247,820 | $90,170 | $157,650 |
| 2019 | $3,829 | $240,610 | $86,680 | $153,930 |
| 2018 | $3,741 | $233,610 | $102,040 | $131,570 |
| 2017 | $3,674 | $226,810 | $99,070 | $127,740 |
| 2016 | $3,628 | $220,210 | $96,180 | $124,030 |
| 2015 | $3,382 | $213,800 | $79,200 | $134,600 |
| 2014 | $3,357 | $207,580 | $94,620 | $112,960 |
Source: Public Records
Map
Nearby Homes
- 33344 SW Rokin Way
- 33348 SW Rokin Way Unit H127
- 33352 SW Rokin Way Unit H128
- 33358 SW Rokin Way
- 33370 SW Rokin Way
- 51925 Columbia River Hwy
- 52396 SW 2nd St
- 32922 Coal Creek Rd
- 33298 SW Meadowbrook Dr
- 51692 SE 3rd St
- 33279 SW Havlik Dr
- 32839 SW Crystal Springs Ct
- 0 Seely Ln
- 33337 SW Havlik Dr
- 51557 SW Em Watts Rd
- 33102 Felisha Way
- 33943 SE Vine St
- 0 Coal Creek Rd
- 51540 SE Westlake Dr Unit 56
- 52256 SE 6th Ct
- 51988 4th St
- 33315 SW Meadow Dr
- 33333 SW Rogers Rd
- 33301 SW Meadow Dr
- 33352 SW Rogers Rd
- 33343 SW Rogers Rd
- 33313 SW Rogers Rd
- 33360 SW Rogers Rd
- 33335 SW Mountain Way
- 51999 SW 4th St
- 33324 SW Mountain Way
- 33444 SW Mountain Way
- 33370 SW Rogers Rd
- 0 SW Rogers Rd Unit 8080094
- 52042 SW 4th St
- 33369 SW Rogers Rd
- 52021 SW 4th St
- 33390 SW Fir Ln