Estimated Value: $2,173,445 - $2,632,000
3
Beds
4
Baths
6,338
Sq Ft
$375/Sq Ft
Est. Value
About This Home
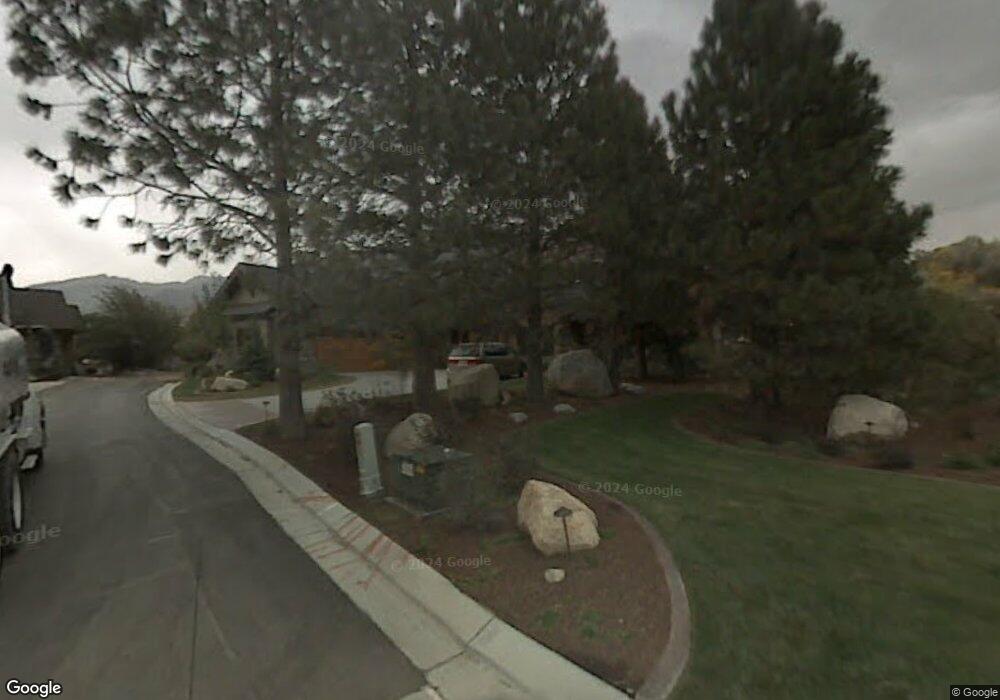
This home is located at 3335 E Wasatch Pines Ln, Sandy, UT 84092 and is currently estimated at $2,376,482, approximately $374 per square foot. 3335 E Wasatch Pines Ln is a home located in Salt Lake County with nearby schools including Granite Elementary School, Albion Middle School, and Brighton High School.
Ownership History
Date
Name
Owned For
Owner Type
Purchase Details
Closed on
Aug 30, 2019
Sold by
Myers Gary J and Myers Constance F
Bought by
Myers Gary J and Myers Constance F
Current Estimated Value
Purchase Details
Closed on
Jun 24, 2015
Sold by
Gee William G and Gee Linda A
Bought by
Myers Gary J and Myers Constance F
Purchase Details
Closed on
Jun 6, 2006
Sold by
Gee William G and Gee Linda A
Bought by
Gee William G and Gee Linda A
Home Financials for this Owner
Home Financials are based on the most recent Mortgage that was taken out on this home.
Original Mortgage
$417,000
Interest Rate
6.56%
Mortgage Type
Fannie Mae Freddie Mac
Purchase Details
Closed on
Oct 18, 2005
Sold by
Gee William G and Gee Linda A
Bought by
Gee William G and Gee Linda A
Purchase Details
Closed on
May 26, 2005
Sold by
Wasatch Pines Development Llc
Bought by
Gee William G and Gee Linda A
Create a Home Valuation Report for This Property
The Home Valuation Report is an in-depth analysis detailing your home's value as well as a comparison with similar homes in the area
Home Values in the Area
Average Home Value in this Area
Purchase History
| Date | Buyer | Sale Price | Title Company |
|---|---|---|---|
| Myers Gary J | -- | None Available | |
| Myers Gary J | -- | First American Title | |
| Gee William G | -- | Backman Title Services | |
| Gee William G | -- | Backman Title Services | |
| Gee William G | -- | None Available | |
| Gee William G | -- | Guardian Title |
Source: Public Records
Mortgage History
| Date | Status | Borrower | Loan Amount |
|---|---|---|---|
| Previous Owner | Gee William G | $417,000 |
Source: Public Records
Tax History
| Year | Tax Paid | Tax Assessment Tax Assessment Total Assessment is a certain percentage of the fair market value that is determined by local assessors to be the total taxable value of land and additions on the property. | Land | Improvement |
|---|---|---|---|---|
| 2025 | $10,144 | $2,037,100 | $480,300 | $1,556,800 |
| 2024 | $10,144 | $1,922,200 | $451,200 | $1,471,000 |
| 2023 | $9,692 | $1,834,900 | $433,800 | $1,401,100 |
| 2022 | $10,312 | $1,920,200 | $425,300 | $1,494,900 |
| 2021 | $9,258 | $1,469,200 | $383,400 | $1,085,800 |
| 2020 | $8,375 | $1,255,200 | $383,400 | $871,800 |
| 2019 | $8,286 | $1,211,800 | $383,400 | $828,400 |
| 2018 | $7,379 | $1,130,000 | $326,700 | $803,300 |
| 2017 | $7,223 | $1,058,900 | $307,400 | $751,500 |
| 2016 | $7,430 | $900,400 | $296,100 | $604,300 |
| 2015 | $7,665 | $864,800 | $335,000 | $529,800 |
| 2014 | -- | $768,300 | $311,300 | $457,000 |
Source: Public Records
Map
Nearby Homes
- 10 La Montagne Ln
- 10043 S Stonewall Ct
- 9862 Granite Slope Dr
- 9512 S Granite Trail Ln E Unit 393
- 9472 S Granite Trail Ln E Unit 391
- 10175 S Dimple Dell Rd
- 9637 S Tannenbaum Cove
- 9623 Tannenbaum Cove
- 2724 Mount Jordan Rd
- 10346 S Grayrock Ct
- 10480 S Seven Springs Cir Unit 23
- 10471 S Wasatch Blvd
- 9942 S Altamont Dr
- 10667 S Hidden Ridge Ln E
- 9969 Altamont Dr
- 9162 S Glenn Abbey Way
- 3316 E Lone Springs Cove
- 2691 E Partridge Cove
- 8967 Cobble Crest Ln
- 3467 Danish Rd
- 3335 Wasatch Pines Ln
- 3304 Wasatch Pines Ln
- 3327 Wasatch Pines Ln
- 9820 S Wasatch Blvd
- 3319 Wasatch Pines Ln
- 3304 E Wasatch Pines Ln
- 3307 Wasatch Pines Ln
- 3307 E Wasatch Pines Ln
- 9782 Jameson Point Cove
- 3342 Little Cottonwood Rd
- 3342 Little Cottonwood Rd
- 3332 Little Cottonwood Rd
- 9778 Jameson Point Cove
- 9778 S Jameson Point Cove
- 3339 E Wasatch Pines Ln
- 3339 Wasatch Pines Ln
- 3298 Wasatch Pines Ln
- 3297 Wasatch Pines Ln
- 9771 Jameson Point Cove
- 3285 Bell Oaks Cir
Your Personal Tour Guide
Ask me questions while you tour the home.