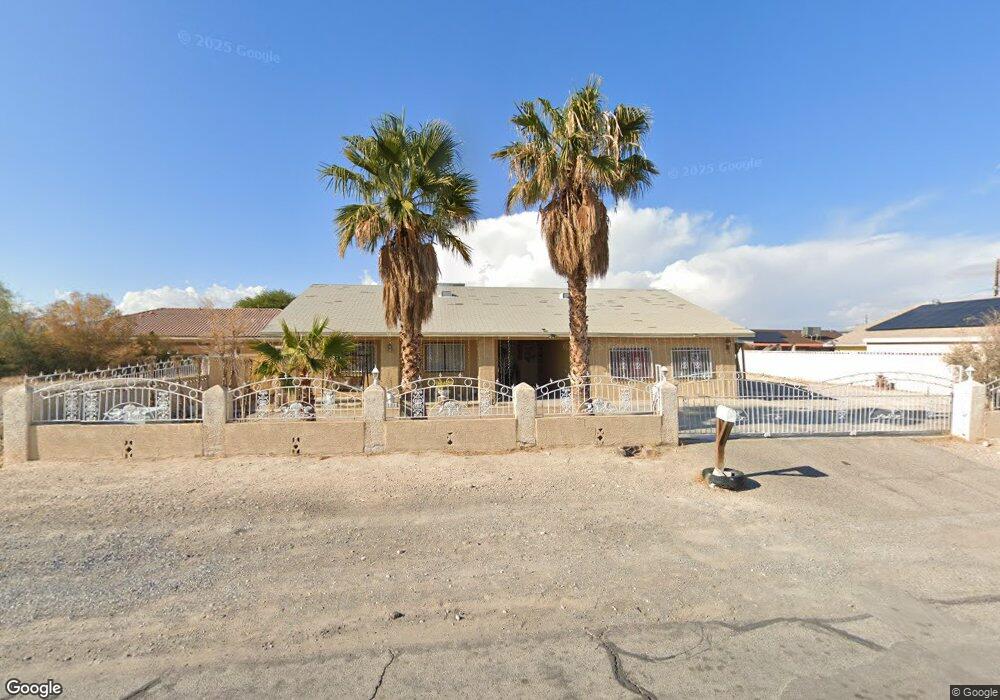
3335 Kemp St North Las Vegas, NV 89032
Cheyenne NeighborhoodEstimated Value: $361,000 - $407,000
3
Beds
2
Baths
1,646
Sq Ft
$234/Sq Ft
Est. Value
About This Home
This home is located at 3335 Kemp St, North Las Vegas, NV 89032 and is currently estimated at $384,798, approximately $233 per square foot. 3335 Kemp St is a home located in Clark County with nearby schools including Richard C. Priest Elementary School, Theron L Swainston Middle School, and Cheyenne High School.
Ownership History
Date
Name
Owned For
Owner Type
Purchase Details
Closed on
Aug 15, 2018
Sold by
Peralta Arcelie
Bought by
Peralta Benson
Current Estimated Value
Purchase Details
Closed on
Jan 11, 2005
Sold by
Bulosan Joey Joe M and Bulosan Rosalinda
Bought by
Bulosan Joey M
Home Financials for this Owner
Home Financials are based on the most recent Mortgage that was taken out on this home.
Original Mortgage
$256,500
Interest Rate
7.55%
Mortgage Type
Unknown
Purchase Details
Closed on
Oct 29, 1998
Sold by
Lujan Alfredo
Bought by
Bulosan Joey Joe M and Bulosan Rosalinda
Home Financials for this Owner
Home Financials are based on the most recent Mortgage that was taken out on this home.
Original Mortgage
$100,000
Interest Rate
9.75%
Create a Home Valuation Report for This Property
The Home Valuation Report is an in-depth analysis detailing your home's value as well as a comparison with similar homes in the area
Home Values in the Area
Average Home Value in this Area
Purchase History
| Date | Buyer | Sale Price | Title Company |
|---|---|---|---|
| Peralta Benson | -- | Roc Title | |
| Peralta Benson | $200,000 | Roc Title | |
| Bulosan Joey Joe | -- | Roc Title | |
| Bulosan Joey M | -- | Stewart Title Of Nevada | |
| Bulosan Joey Joe M | $125,000 | Land Title | |
| Lujan Alfredo | -- | Land Title |
Source: Public Records
Mortgage History
| Date | Status | Borrower | Loan Amount |
|---|---|---|---|
| Previous Owner | Bulosan Joey M | $256,500 | |
| Previous Owner | Lujan Alfredo | $100,000 | |
| Closed | Lujan Alfredo | $25,000 |
Source: Public Records
Tax History Compared to Growth
Tax History
| Year | Tax Paid | Tax Assessment Tax Assessment Total Assessment is a certain percentage of the fair market value that is determined by local assessors to be the total taxable value of land and additions on the property. | Land | Improvement |
|---|---|---|---|---|
| 2025 | $1,441 | $82,805 | $33,250 | $49,555 |
| 2024 | $1,335 | $82,805 | $33,250 | $49,555 |
| 2023 | $1,335 | $78,467 | $31,150 | $47,317 |
| 2022 | $1,236 | $68,007 | $24,500 | $43,507 |
| 2021 | $1,145 | $59,100 | $17,500 | $41,600 |
| 2020 | $1,060 | $57,208 | $15,750 | $41,458 |
| 2019 | $1,011 | $56,484 | $15,400 | $41,084 |
| 2018 | $965 | $52,776 | $12,950 | $39,826 |
| 2017 | $1,772 | $52,829 | $12,250 | $40,579 |
| 2016 | $904 | $50,358 | $12,250 | $38,108 |
| 2015 | $902 | $43,771 | $10,500 | $33,271 |
| 2014 | $875 | $47,444 | $7,000 | $40,444 |
Source: Public Records
Map
Nearby Homes
- 0 N Ernest St
- 3440 Ernest St
- 3439 Cox St
- 3304 Simmons St
- 1981 Komodo Dragon Ct
- 3524 Simmons St
- 2906 Carothers Ct
- 3104 W Colton Ave Unit 1
- 3834 W Gowan Rd
- 0 Simmons & Logan 3 Unit 2722103
- 3355 Clayton St
- 0 Simmons & Logan 2 Unit 2722091
- 3301 W Colton Ave
- 410 Rocky Peak Dr Unit 1704
- 3548 Valley Lily St
- 0 Simmons & Logan Unit 2721829
- 3556 Valley Lily St
- 3323 Outlook Point St
- 3336 Cheyenne Gardens Way
- 00 Ward