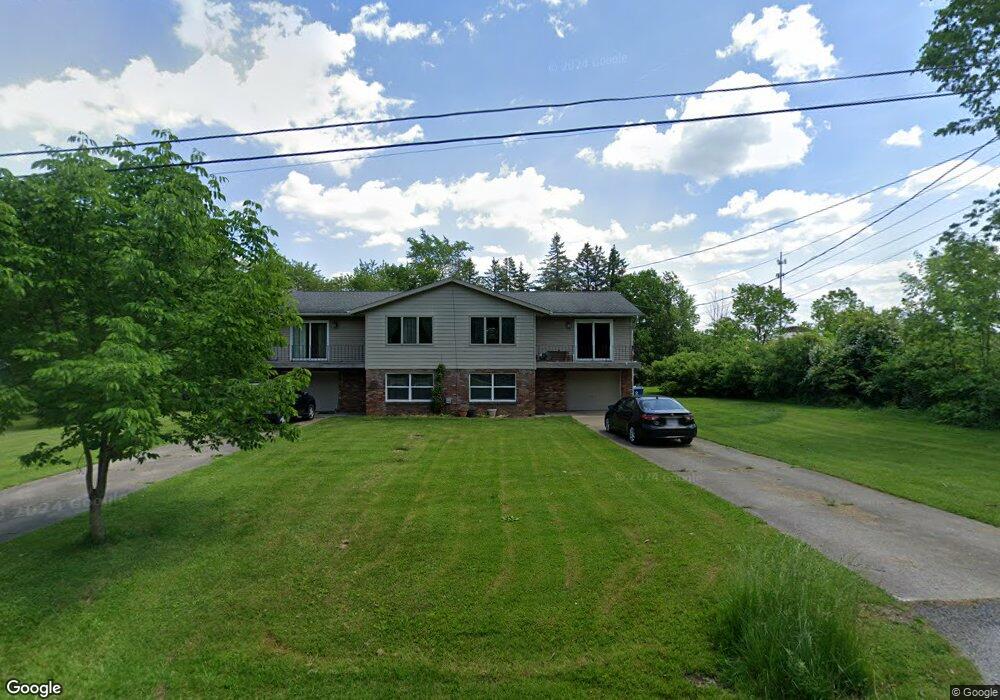
3335 Pikeview Dr Unit 3339 Norton, OH 44203
Estimated Value: $210,000 - $266,000
4
Beds
4
Baths
1,638
Sq Ft
$142/Sq Ft
Est. Value
About This Home
This home is located at 3335 Pikeview Dr Unit 3339, Norton, OH 44203 and is currently estimated at $232,651, approximately $142 per square foot. 3335 Pikeview Dr Unit 3339 is a home located in Summit County with nearby schools including Norton Primary Elementary School, Norton Middle School, and Norton High School.
Ownership History
Date
Name
Owned For
Owner Type
Purchase Details
Closed on
Dec 28, 2016
Sold by
Fleet Craig and Fleet Vickey L
Bought by
Dipietro Lorri J
Current Estimated Value
Home Financials for this Owner
Home Financials are based on the most recent Mortgage that was taken out on this home.
Original Mortgage
$6,950
Outstanding Balance
$5,698
Interest Rate
3.94%
Mortgage Type
Stand Alone Second
Estimated Equity
$226,953
Purchase Details
Closed on
Nov 3, 2005
Sold by
Karam Elias J and Karam Gloria J
Bought by
Fleet Craig and Fleet Vicky L
Home Financials for this Owner
Home Financials are based on the most recent Mortgage that was taken out on this home.
Original Mortgage
$125,000
Interest Rate
6.04%
Mortgage Type
Fannie Mae Freddie Mac
Purchase Details
Closed on
Sep 10, 2004
Sold by
Simon & Karam Enterprises
Bought by
Karam Elias J and Karam Gloria J
Create a Home Valuation Report for This Property
The Home Valuation Report is an in-depth analysis detailing your home's value as well as a comparison with similar homes in the area
Home Values in the Area
Average Home Value in this Area
Purchase History
| Date | Buyer | Sale Price | Title Company |
|---|---|---|---|
| Dipietro Lorri J | $139,000 | America Land Title Affiliate | |
| Fleet Craig | $139,000 | Land America-Lawyers Title | |
| Karam Elias J | -- | Land America-Lawyers Title |
Source: Public Records
Mortgage History
| Date | Status | Borrower | Loan Amount |
|---|---|---|---|
| Open | Dipietro Lorri J | $6,950 | |
| Previous Owner | Fleet Craig | $125,000 |
Source: Public Records
Tax History Compared to Growth
Tax History
| Year | Tax Paid | Tax Assessment Tax Assessment Total Assessment is a certain percentage of the fair market value that is determined by local assessors to be the total taxable value of land and additions on the property. | Land | Improvement |
|---|---|---|---|---|
| 2025 | $2,194 | $53,194 | $15,810 | $37,384 |
| 2024 | $2,194 | $53,194 | $15,810 | $37,384 |
| 2023 | $2,194 | $53,194 | $15,810 | $37,384 |
| 2022 | $2,230 | $44,367 | $10,133 | $34,234 |
| 2021 | $2,241 | $44,367 | $10,133 | $34,234 |
| 2020 | $2,096 | $44,360 | $10,130 | $34,230 |
| 2019 | $2,473 | $45,970 | $10,130 | $35,840 |
| 2018 | $2,432 | $45,970 | $10,130 | $35,840 |
| 2017 | $2,488 | $45,970 | $10,130 | $35,840 |
| 2016 | $2,488 | $42,420 | $10,130 | $32,290 |
| 2015 | $2,488 | $42,420 | $10,130 | $32,290 |
| 2014 | $2,465 | $42,420 | $10,130 | $32,290 |
| 2013 | $2,450 | $42,620 | $10,130 | $32,490 |
Source: Public Records
Map
Nearby Homes
- S/L 179 Belt Line Dr
- 3720 Strawboard Ave
- Grand Cayman Plan at Brookside Greens - Ranches
- Eden Cay Plan at Brookside Greens - Ranches
- Aruba Bay Plan at Brookside Greens - Ranches
- Grand Bahama Plan at Brookside Greens - Ranches
- 3738 Kirkham Dr
- 3923 Higgins Dr
- Birch w/ Basement Plan at Brookside Greens - 2-Story
- Hazel w/ Basement Plan at Brookside Greens - 2-Story
- Aspen w/ Basement Plan at Brookside Greens - 2-Story
- Elder w/ Basement Plan at Brookside Greens - 2-Story
- Cedar w/ Basement Plan at Brookside Greens - 2-Story
- 3724 Alumina Dr
- 3732 Alumina Dr
- 3270 Glenbrook Dr
- 3303 Glenbrook Dr
- 3873 Easton Rd
- Deer Valley Plan at The Reserve at Sharon
- Skyview Plan at The Reserve at Sharon
- 3335 3339 Pikeview Dr
- 3323 Pikeview Dr Unit 3327
- 3311 3315 Pikeview Dr
- 3311 Pikeview Dr Unit 3315
- 3808 S Neitz Dr
- 3299 Pikeview Dr Unit 3305
- 3816 S Neitz Dr
- 3809 S Neitz Dr
- 3291 Pikeview Dr Unit 3293
- 3828 S Neitz Dr
- 3780 N Neitz Dr
- 3279 Pikeview Dr
- 3790 N Neitz Dr
- 3837 S Neitz Dr
- 3836 S Neitz Dr
- 3800 N Neitz Dr
- 3269 Pikeview Dr Unit 3271
- 3818 N Neitz Dr
- 3844 S Neitz Dr
- 3781 N Neitz Dr