Estimated Value: $247,596 - $294,000
3
Beds
3
Baths
1,525
Sq Ft
$178/Sq Ft
Est. Value
About This Home
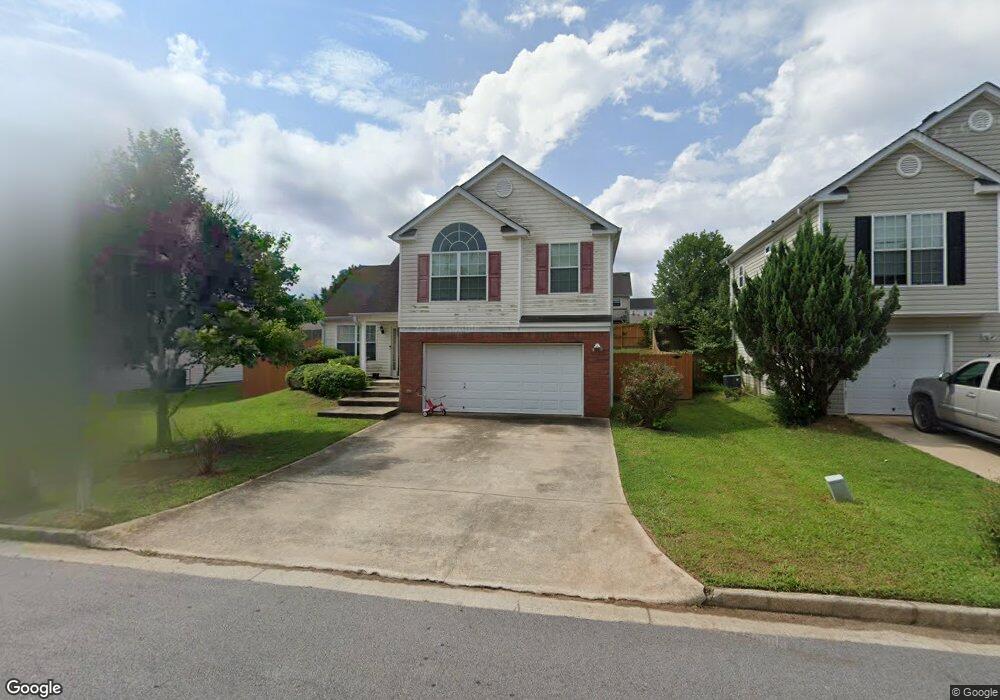
This home is located at 3335 Waggoner Trail, Rex, GA 30273 and is currently estimated at $270,899, approximately $177 per square foot. 3335 Waggoner Trail is a home located in Clayton County with nearby schools including East Clayton Elementary School, Adamson Middle School, and Morrow High School.
Ownership History
Date
Name
Owned For
Owner Type
Purchase Details
Closed on
Apr 30, 2018
Sold by
Evans Andre B
Bought by
Flowers Marquis Jerod
Current Estimated Value
Home Financials for this Owner
Home Financials are based on the most recent Mortgage that was taken out on this home.
Original Mortgage
$136,875
Outstanding Balance
$118,054
Interest Rate
4.75%
Mortgage Type
FHA
Estimated Equity
$152,845
Purchase Details
Closed on
Mar 30, 2006
Sold by
Gt Homes Llc
Bought by
Evans Andre B
Home Financials for this Owner
Home Financials are based on the most recent Mortgage that was taken out on this home.
Original Mortgage
$151,100
Interest Rate
6.23%
Mortgage Type
FHA
Purchase Details
Closed on
Jun 10, 2005
Sold by
Southside Dev Inc
Bought by
Gt Homes Llc
Home Financials for this Owner
Home Financials are based on the most recent Mortgage that was taken out on this home.
Original Mortgage
$433,477
Interest Rate
5.7%
Create a Home Valuation Report for This Property
The Home Valuation Report is an in-depth analysis detailing your home's value as well as a comparison with similar homes in the area
Home Values in the Area
Average Home Value in this Area
Purchase History
| Date | Buyer | Sale Price | Title Company |
|---|---|---|---|
| Flowers Marquis Jerod | $139,400 | -- | |
| Evans Andre B | $152,400 | -- | |
| Gt Homes Llc | $156,000 | -- |
Source: Public Records
Mortgage History
| Date | Status | Borrower | Loan Amount |
|---|---|---|---|
| Open | Flowers Marquis Jerod | $136,875 | |
| Previous Owner | Evans Andre B | $151,100 | |
| Previous Owner | Gt Homes Llc | $433,477 |
Source: Public Records
Tax History
| Year | Tax Paid | Tax Assessment Tax Assessment Total Assessment is a certain percentage of the fair market value that is determined by local assessors to be the total taxable value of land and additions on the property. | Land | Improvement |
|---|---|---|---|---|
| 2025 | $4,156 | $107,520 | $8,800 | $98,720 |
| 2024 | $4,365 | $110,920 | $8,800 | $102,120 |
| 2023 | $3,938 | $109,080 | $8,800 | $100,280 |
| 2022 | $3,594 | $90,600 | $8,800 | $81,800 |
| 2021 | $2,837 | $70,880 | $8,800 | $62,080 |
| 2020 | $2,603 | $64,134 | $8,800 | $55,334 |
| 2019 | $2,241 | $54,273 | $8,800 | $45,473 |
| 2018 | $1,590 | $48,222 | $8,800 | $39,422 |
| 2017 | $1,275 | $40,411 | $8,800 | $31,611 |
| 2016 | $897 | $31,107 | $8,800 | $22,307 |
| 2015 | $781 | $0 | $0 | $0 |
| 2014 | $764 | $28,236 | $9,600 | $18,636 |
Source: Public Records
Map
Nearby Homes
- 5806 Waggoner Ct
- 5914 Waggoner Ct
- 5954 Rex Ridge Ct
- 5781 Creekside Dr
- 5798 Creekside Dr Unit 4
- 5953 Farmbrook Ln Unit 1
- 3548 Meadowview Ct
- 5602 Swanson Rd
- 5652 Laney Dr
- 5640 Laney Dr
- 5952 Meadow Ln
- 3099 Chippewa Dr
- 5861 Colonnade Dr
- 5502 Amelia Ln
- 6103 Chaseland Dr
- 6103 Chaseland Rd
- 5838 Highway 42
- 3668 Paddington Trail
- 3669 Arminto Dr
- 3684 Paddington Trail
- 3341 Waggoner Trail
- 3329 Waggoner Trail
- 3334 Waggoner Place
- 3340 Waggoner Place
- 3347 Waggoner Trail
- 3328 Waggoner Place
- 3323 Waggoner Trail
- 3332 Waggoner Trail
- 3346 Waggoner Place
- 3338 Waggoner Trail
- 3322 Waggoner Place
- 3353 Waggoner Trail
- 3317 Waggoner Trail
- 3344 Waggoner Trail
- 3344 Waggoner Trail Unit Rooms In A Castle
- 3344 Waggoner Trail
- 3320 Waggoner Trail
- 3352 Waggoner Place Unit 112
- 3352 Waggoner Place
- 3316 Waggoner Place
Your Personal Tour Guide
Ask me questions while you tour the home.