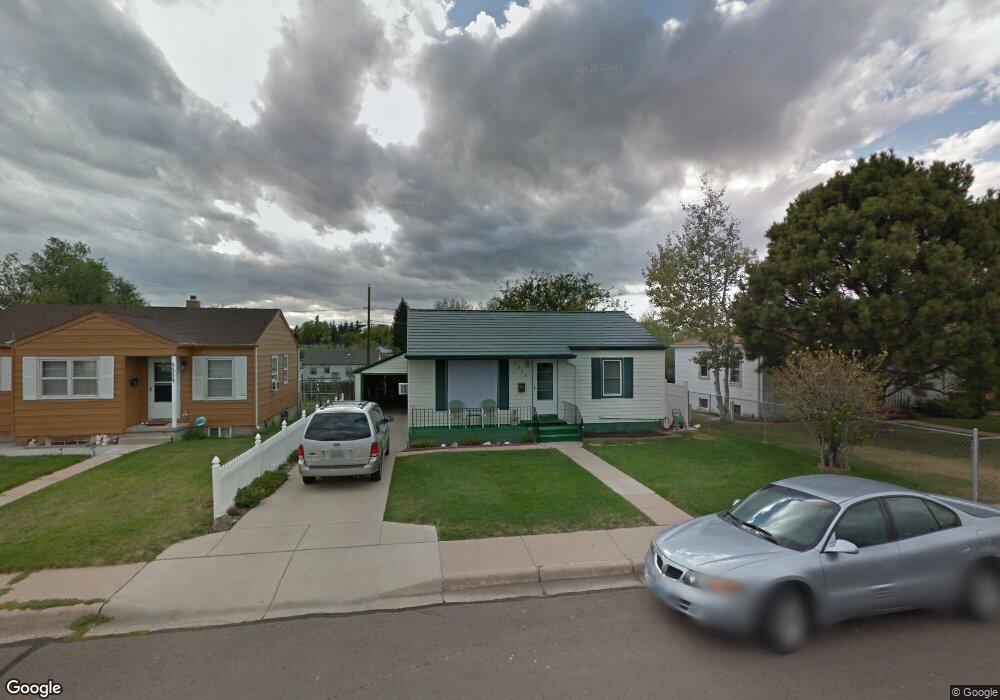
3336 Alexander Ave Cheyenne, WY 82001
Estimated Value: $292,000 - $325,058
3
Beds
2
Baths
1,065
Sq Ft
$284/Sq Ft
Est. Value
About This Home
This home is located at 3336 Alexander Ave, Cheyenne, WY 82001 and is currently estimated at $302,515, approximately $284 per square foot. 3336 Alexander Ave is a home located in Laramie County with nearby schools including Henderson Elementary School, Carey Junior High School, and East High School.
Ownership History
Date
Name
Owned For
Owner Type
Purchase Details
Closed on
Nov 25, 2024
Sold by
Mccleave Nancy F
Bought by
Way Up North Llc
Current Estimated Value
Purchase Details
Closed on
Mar 23, 2021
Sold by
Mccleave Allan E and Mccleave Nancy F
Bought by
Mccleave Allan E and Mccleave Nancy F
Purchase Details
Closed on
Jul 17, 2002
Sold by
Mccleave Allan E and Mccleave Nancy F
Bought by
Mccleave Allan E and Mccleave Nancy F
Purchase Details
Closed on
Feb 27, 2001
Sold by
Mccleave Allan E
Bought by
Mccleave Allan E and Bemis Nancy
Home Financials for this Owner
Home Financials are based on the most recent Mortgage that was taken out on this home.
Original Mortgage
$77,000
Interest Rate
7.19%
Create a Home Valuation Report for This Property
The Home Valuation Report is an in-depth analysis detailing your home's value as well as a comparison with similar homes in the area
Home Values in the Area
Average Home Value in this Area
Purchase History
| Date | Buyer | Sale Price | Title Company |
|---|---|---|---|
| Way Up North Llc | -- | Flying S Title & Escrow | |
| Way Up North Llc | -- | Flying S Title & Escrow | |
| Mccleave Allan E | -- | None Listed On Document | |
| Mccleave Allan E | -- | First American Title Ins Co | |
| Mccleave Allan E | -- | -- |
Source: Public Records
Mortgage History
| Date | Status | Borrower | Loan Amount |
|---|---|---|---|
| Previous Owner | Mccleave Allan E | $77,000 |
Source: Public Records
Tax History Compared to Growth
Tax History
| Year | Tax Paid | Tax Assessment Tax Assessment Total Assessment is a certain percentage of the fair market value that is determined by local assessors to be the total taxable value of land and additions on the property. | Land | Improvement |
|---|---|---|---|---|
| 2025 | $1,584 | $21,286 | $2,797 | $18,489 |
| 2024 | $1,584 | $25,395 | $3,729 | $21,666 |
| 2023 | $1,610 | $25,765 | $3,729 | $22,036 |
| 2022 | $1,342 | $21,593 | $3,729 | $17,864 |
| 2021 | $1,260 | $20,417 | $3,729 | $16,688 |
| 2020 | $1,073 | $17,875 | $3,729 | $14,146 |
| 2019 | $1,019 | $17,109 | $3,729 | $13,380 |
| 2018 | $894 | $15,494 | $3,451 | $12,043 |
| 2017 | $871 | $15,073 | $3,451 | $11,622 |
| 2016 | $811 | $14,227 | $3,295 | $10,932 |
| 2015 | $709 | $12,815 | $3,295 | $9,520 |
| 2014 | $726 | $12,987 | $3,295 | $9,692 |
Source: Public Records
Map
Nearby Homes
- 1120 Black Ct
- 1214 E 23rd St
- 3533 Duff Ave
- 1115 E 23rd St
- 1208 E 22nd St
- 1100 E 22nd St
- 3561 Amherst Rd
- 1210 E 5th Ave
- 2114 Rollins Ave
- 1502 Andover Dr
- 3561 Boston Rd
- 2013 Dunn Ave
- 1206 E 19th St
- 1770 Andover Dr
- 1510 Seymour Ave
- 1717 Alexander Ave Unit 502
- 1763 Milton Dr
- 2417 Evans Ave
- 414 E 22nd St
- 1847 Milton Dr
- 3340 Alexander Ave
- 3334 Alexander Ave
- 3344 Alexander Ave
- 3332 Alexander Ave
- 3337 Duff Ave
- 3341 Duff Ave
- 3335 Duff Ave
- 3348 Alexander Ave
- 3326 Alexander Ave
- 3345 Duff Ave
- 3337 Alexander Ave
- 3335 Alexander Ave
- 3341 Alexander Ave
- 3345 Alexander Ave
- 3352 Alexander Ave
- 3349 Duff Ave
- 3333 Alexander Ave
- 3322 Alexander Ave
- 3327 Duff Ave
- 3327 Alexander Ave