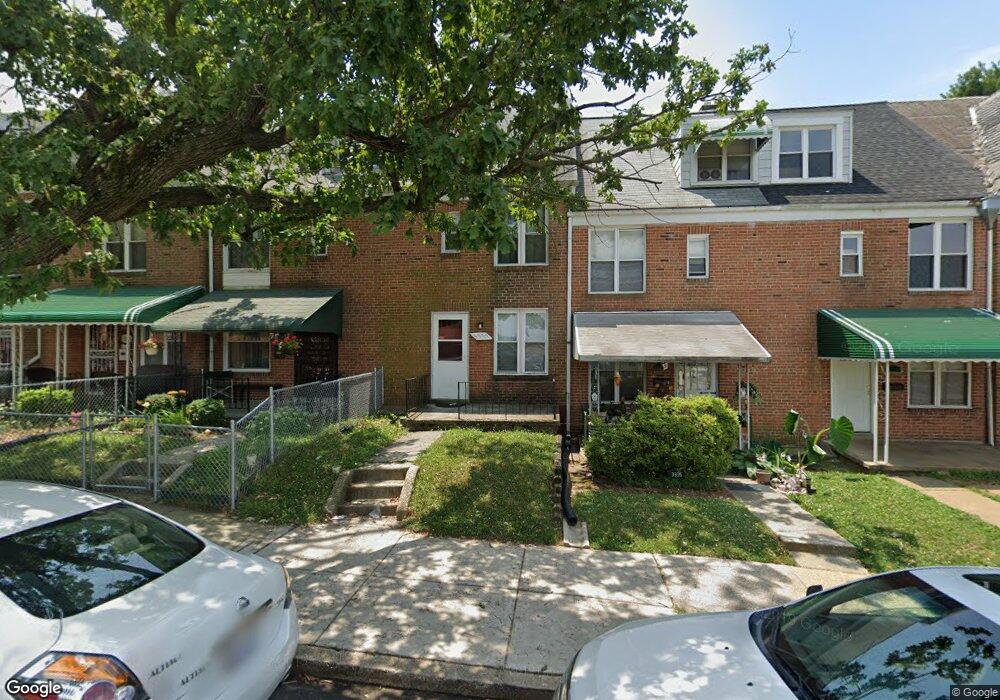
3337 Kentucky Ave Baltimore, MD 21213
Belair-Edison NeighborhoodEstimated Value: $151,684 - $190,000
3
Beds
2
Baths
870
Sq Ft
$196/Sq Ft
Est. Value
About This Home
This home is located at 3337 Kentucky Ave, Baltimore, MD 21213 and is currently estimated at $170,842, approximately $196 per square foot. 3337 Kentucky Ave is a home located in Baltimore City with nearby schools including Booker T. Washington Middle School, Paul Laurence Dunbar High School, and Patterson High School.
Ownership History
Date
Name
Owned For
Owner Type
Purchase Details
Closed on
Jun 17, 2010
Sold by
Yeager John Michael
Bought by
Thompson Judy
Current Estimated Value
Home Financials for this Owner
Home Financials are based on the most recent Mortgage that was taken out on this home.
Original Mortgage
$3,500
Outstanding Balance
$2,347
Interest Rate
4.98%
Mortgage Type
Stand Alone Second
Estimated Equity
$168,495
Purchase Details
Closed on
Sep 5, 2007
Sold by
Yeager John Robert
Bought by
Yeager John Michael
Purchase Details
Closed on
Mar 16, 2006
Sold by
John R Yeager Wf
Bought by
Yeager John Robert and Yeager Rachel F
Home Financials for this Owner
Home Financials are based on the most recent Mortgage that was taken out on this home.
Original Mortgage
$35,000
Interest Rate
6.27%
Mortgage Type
New Conventional
Create a Home Valuation Report for This Property
The Home Valuation Report is an in-depth analysis detailing your home's value as well as a comparison with similar homes in the area
Home Values in the Area
Average Home Value in this Area
Purchase History
| Date | Buyer | Sale Price | Title Company |
|---|---|---|---|
| Thompson Judy | $113,000 | -- | |
| Yeager John Michael | -- | -- | |
| Yeager John Robert | $11,666 | -- |
Source: Public Records
Mortgage History
| Date | Status | Borrower | Loan Amount |
|---|---|---|---|
| Open | Thompson Judy | $3,500 | |
| Open | Thompson Judy | $110,430 | |
| Previous Owner | Yeager John Robert | $35,000 |
Source: Public Records
Tax History Compared to Growth
Tax History
| Year | Tax Paid | Tax Assessment Tax Assessment Total Assessment is a certain percentage of the fair market value that is determined by local assessors to be the total taxable value of land and additions on the property. | Land | Improvement |
|---|---|---|---|---|
| 2025 | $2,452 | $125,000 | -- | -- |
| 2024 | $2,452 | $120,100 | $30,000 | $90,100 |
| 2023 | $951 | $111,967 | $0 | $0 |
| 2022 | $1,109 | $103,833 | $0 | $0 |
| 2021 | $2,259 | $95,700 | $30,000 | $65,700 |
| 2020 | $663 | $95,700 | $30,000 | $65,700 |
| 2019 | $1,753 | $95,700 | $30,000 | $65,700 |
| 2018 | $724 | $104,500 | $30,000 | $74,500 |
| 2017 | $791 | $99,933 | $0 | $0 |
| 2016 | $2,385 | $95,367 | $0 | $0 |
| 2015 | $2,385 | $90,800 | $0 | $0 |
| 2014 | $2,385 | $90,800 | $0 | $0 |
Source: Public Records
Map
Nearby Homes
- 3401 Kentucky Ave
- 3211 Chesterfield Ave
- 3225 Kenyon Ave
- 3436 Cliftmont Ave
- 3314 Kenyon Ave
- 3203 Kenyon Ave
- 3519 Kentucky Ave
- 3239 Dudley Ave
- 3114 Pelham Ave
- 3229 Dudley Ave
- 3438 Juneway
- 3126 Kenyon Ave
- 3300 Dudley Ave
- 3028 Chesterfield Ave
- 3100 Kenyon Ave
- 3425 Juneway
- 3401 Ramona Ave
- 3009 Kentucky Ave
- 3522 Erdman Ave
- 3003 Kentucky Ave
- 3335 Kentucky Ave
- 3333 Kentucky Ave
- 3339 Kentucky Ave
- 3331 Kentucky Ave
- 3341 Kentucky Ave
- 3329 Kentucky Ave
- 3343 Kentucky Ave
- 3327 Kentucky Ave
- 3345 Kentucky Ave
- 3325 Kentucky Ave
- 3336 Brendan Ave
- 3334 Brendan Ave
- 3323 Kentucky Ave
- 3347 Kentucky Ave
- 3332 Brendan Ave
- 3330 Brendan Ave
- 3328 Brendan Ave
- 3321 Kentucky Ave
- 3326 Brendan Ave
- 3319 Kentucky Ave