3338 115th Ave Allegan, MI 49010
Estimated Value: $220,000 - $288,000
2
Beds
1
Bath
1,296
Sq Ft
$193/Sq Ft
Est. Value
About This Home
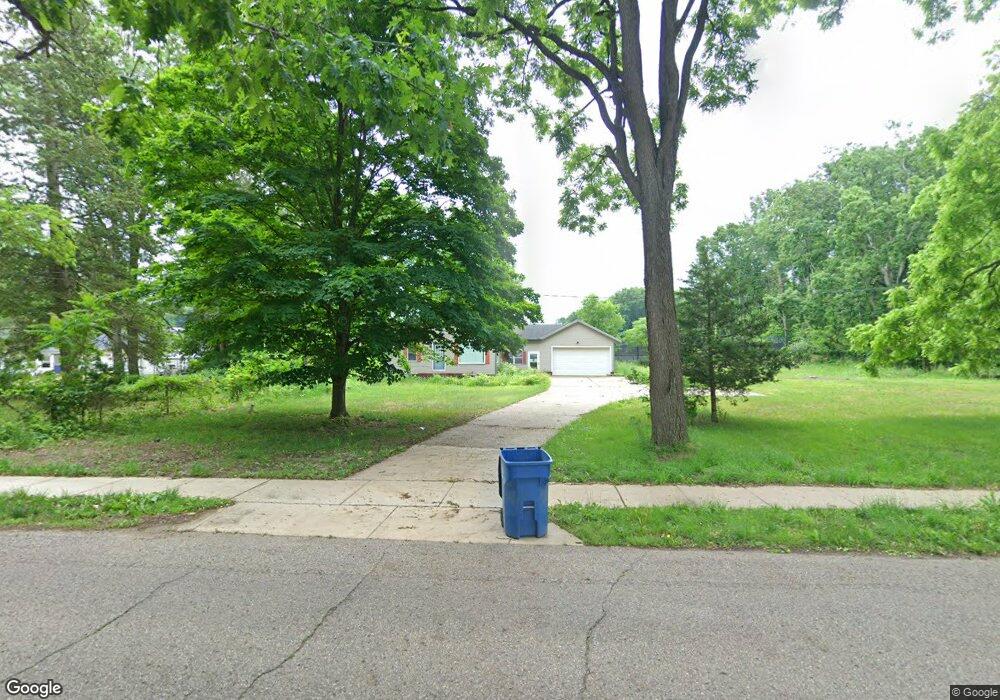
This home is located at 3338 115th Ave, Allegan, MI 49010 and is currently estimated at $250,405, approximately $193 per square foot. 3338 115th Ave is a home located in Allegan County with nearby schools including West Ward Elementary School, L.E. White Middle School, and Allegan High School.
Ownership History
Date
Name
Owned For
Owner Type
Purchase Details
Closed on
Feb 23, 2007
Sold by
Ingles David J and Ingles Pamela J
Bought by
Beldon Ruth E
Current Estimated Value
Home Financials for this Owner
Home Financials are based on the most recent Mortgage that was taken out on this home.
Original Mortgage
$116,975
Outstanding Balance
$70,529
Interest Rate
6.28%
Mortgage Type
FHA
Estimated Equity
$179,876
Purchase Details
Closed on
Dec 31, 2001
Sold by
Tiller Family Revocable Trust
Bought by
Ingles David J and Ingles Pamela J
Home Financials for this Owner
Home Financials are based on the most recent Mortgage that was taken out on this home.
Original Mortgage
$97,400
Interest Rate
7.07%
Purchase Details
Closed on
Mar 11, 1999
Sold by
Tiller Carrol
Bought by
Tiller Family Trust
Create a Home Valuation Report for This Property
The Home Valuation Report is an in-depth analysis detailing your home's value as well as a comparison with similar homes in the area
Home Values in the Area
Average Home Value in this Area
Purchase History
| Date | Buyer | Sale Price | Title Company |
|---|---|---|---|
| Beldon Ruth E | $117,900 | Devon Title Agency | |
| Ingles David J | $102,570 | Metropolitan Title Co | |
| Tiller Family Trust | -- | -- |
Source: Public Records
Mortgage History
| Date | Status | Borrower | Loan Amount |
|---|---|---|---|
| Open | Beldon Ruth E | $116,975 | |
| Previous Owner | Ingles David J | $97,400 |
Source: Public Records
Tax History Compared to Growth
Tax History
| Year | Tax Paid | Tax Assessment Tax Assessment Total Assessment is a certain percentage of the fair market value that is determined by local assessors to be the total taxable value of land and additions on the property. | Land | Improvement |
|---|---|---|---|---|
| 2025 | $1,835 | $109,000 | $18,500 | $90,500 |
| 2024 | $1,670 | $102,600 | $17,000 | $85,600 |
| 2023 | $1,670 | $89,700 | $13,700 | $76,000 |
| 2022 | $1,670 | $76,900 | $11,200 | $65,700 |
| 2021 | $1,547 | $71,400 | $9,600 | $61,800 |
| 2020 | $1,547 | $65,000 | $8,300 | $56,700 |
| 2019 | $0 | $63,400 | $8,300 | $55,100 |
| 2018 | $0 | $58,800 | $8,300 | $50,500 |
| 2017 | $0 | $53,200 | $6,700 | $46,500 |
| 2016 | $0 | $49,800 | $6,200 | $43,600 |
| 2015 | -- | $49,800 | $6,200 | $43,600 |
| 2014 | -- | $45,800 | $6,000 | $39,800 |
| 2013 | -- | $45,400 | $6,000 | $39,400 |
Source: Public Records
Map
Nearby Homes