3338 E Main St Bridgeport, CT 06610
North Bridgeport NeighborhoodEstimated Value: $486,000 - $598,000
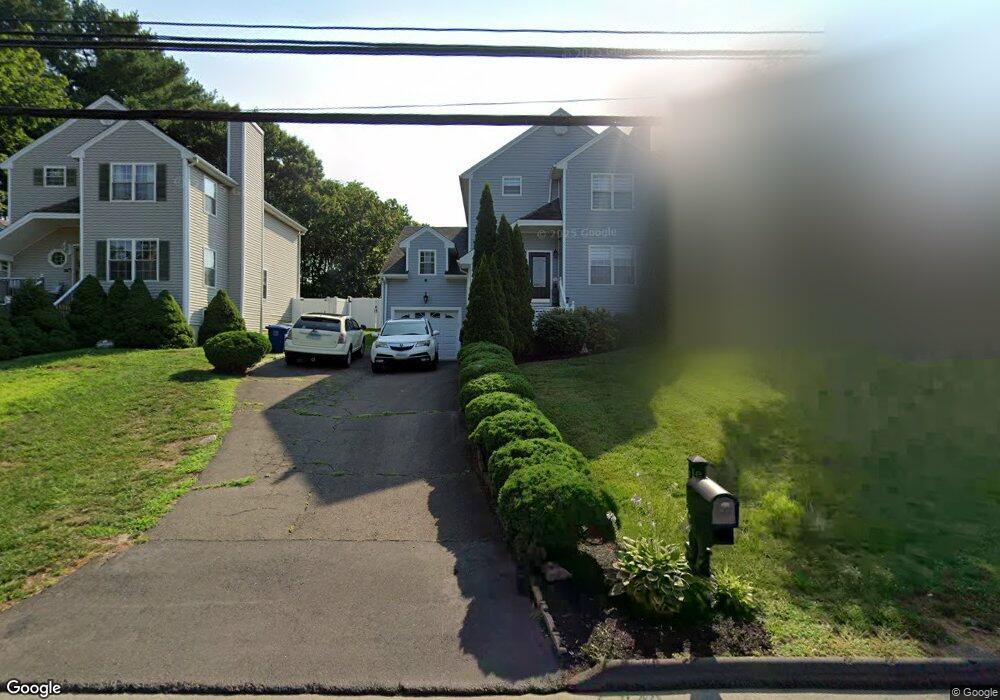
About This Home
This home is located at 3338 E Main St, Bridgeport, CT 06610 and is currently estimated at $530,229, approximately $274 per square foot. 3338 E Main St is a home located in Fairfield County with nearby schools including Hooker School and Harding High School.
Ownership History
We collect this data history from publicly available records. To have your information removed, we recommend requesting removal directly through your county’s website.
Purchase Details
Home Financials for this Owner
Home Financials are based on the most recent Mortgage that was taken out on this home.Purchase Details
Home Values in the Area
Average Home Value in this Area
Purchase History
We collect this data history from publicly available records. To have your information removed, we recommend requesting removal directly through your county’s website.
| Date | Buyer | Sale Price | Title Company |
|---|---|---|---|
| $345,000 | -- | ||
| $345,000 | -- | ||
| $150,000 | -- | ||
| $150,000 | -- |
Mortgage History
We collect this data history from publicly available records. To have your information removed, we recommend requesting removal directly through your county’s website.
| Date | Status | Borrower | Loan Amount |
|---|---|---|---|
| Open | $278,000 | ||
| Closed | $308,550 | ||
| Previous Owner | $144,700 |
Tax History
We collect this data history from publicly available records. To have your information removed, we recommend requesting removal directly through your county’s website.
| Year | Tax Paid | Tax Assessment Tax Assessment Total Assessment is a certain percentage of the fair market value that is determined by local assessors to be the total taxable value of land and additions on the property. | Land | Improvement |
|---|---|---|---|---|
| 2025 | $8,853 | $203,760 | $57,550 | $146,210 |
| 2024 | $8,853 | $203,760 | $57,550 | $146,210 |
| 2023 | $8,853 | $203,760 | $57,550 | $146,210 |
| 2022 | $8,853 | $203,760 | $57,550 | $146,210 |
| 2021 | $8,853 | $203,760 | $57,550 | $146,210 |
| 2020 | $9,780 | $181,140 | $47,280 | $133,860 |
| 2019 | $9,780 | $181,140 | $47,280 | $133,860 |
| 2018 | $9,849 | $181,140 | $47,280 | $133,860 |
| 2017 | $9,849 | $181,140 | $47,280 | $133,860 |
| 2016 | $9,849 | $181,140 | $47,280 | $133,860 |
| 2015 | $8,789 | $208,280 | $46,100 | $162,180 |
| 2014 | $8,789 | $208,280 | $46,100 | $162,180 |
Map
- 11 Beverly Dr
- 437 Huntington Turnpike
- 265 Jennings Ave
- 217 Hillcrest Rd
- 104 Oakdale St
- 3 Lane Ave
- 109 Barclay St
- 156 Dayton Rd
- 150 Hillcrest Rd
- 2776 E Main St
- 65 Westmere St
- 465 Evers St
- 120 Huntington Turnpike Unit 809
- 12 Court c Unit Bdlg 61
- 180 Dupont Place Unit 182
- 264 Texas Ave
- 49 Mencel Cir Unit B
- 243 White Plains Rd
- 58 Mencel Cir Unit C
- 147 Trumbull Ave
Ask me questions while you tour the home.