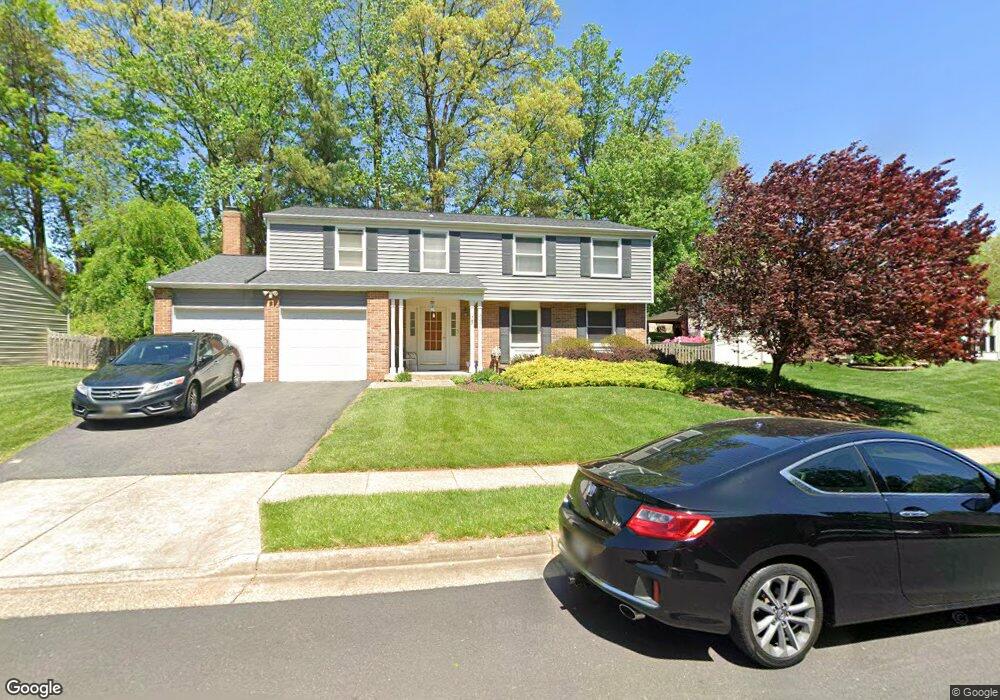
3338 Happy Heart Ln Annandale, VA 22003
Estimated Value: $896,000 - $913,151
4
Beds
3
Baths
2,240
Sq Ft
$404/Sq Ft
Est. Value
About This Home
This home is located at 3338 Happy Heart Ln, Annandale, VA 22003 and is currently estimated at $904,538, approximately $403 per square foot. 3338 Happy Heart Ln is a home located in Fairfax County with nearby schools including Camelot Elementary School, Luther Jackson Middle School, and Falls Church High School.
Ownership History
Date
Name
Owned For
Owner Type
Purchase Details
Closed on
Jul 7, 2016
Sold by
Skolaski Paul
Bought by
Arif Roberta S
Current Estimated Value
Purchase Details
Closed on
Apr 15, 2016
Sold by
Arif Roberta S
Bought by
Rsa Trust
Purchase Details
Closed on
Mar 1, 2016
Sold by
Arif Roberta S
Bought by
Skolaski Paul
Purchase Details
Closed on
Feb 22, 2016
Sold by
Rsa Trust Dated Apri 15 2015
Bought by
Arif Roberta S
Purchase Details
Closed on
Apr 15, 2015
Sold by
Arif Roberta
Bought by
Arie Tr Roberta S
Purchase Details
Closed on
Nov 7, 2014
Sold by
Arif Michael S and Arif Roberta
Bought by
Arif Roberta
Purchase Details
Closed on
Mar 30, 1999
Sold by
Fox Joseph C
Bought by
Arif Michael S
Home Financials for this Owner
Home Financials are based on the most recent Mortgage that was taken out on this home.
Original Mortgage
$204,000
Interest Rate
6.78%
Create a Home Valuation Report for This Property
The Home Valuation Report is an in-depth analysis detailing your home's value as well as a comparison with similar homes in the area
Home Values in the Area
Average Home Value in this Area
Purchase History
| Date | Buyer | Sale Price | Title Company |
|---|---|---|---|
| Arif Roberta S | -- | Resource Real Est Svcs Llc | |
| Rsa Trust | -- | None Available | |
| Skolaski Paul | -- | None Available | |
| Arif Roberta S | -- | None Available | |
| Arie Tr Roberta S | -- | -- | |
| Arif Roberta | -- | -- | |
| Arif Michael S | $255,000 | -- |
Source: Public Records
Mortgage History
| Date | Status | Borrower | Loan Amount |
|---|---|---|---|
| Previous Owner | Arif Michael S | $204,000 |
Source: Public Records
Tax History Compared to Growth
Tax History
| Year | Tax Paid | Tax Assessment Tax Assessment Total Assessment is a certain percentage of the fair market value that is determined by local assessors to be the total taxable value of land and additions on the property. | Land | Improvement |
|---|---|---|---|---|
| 2025 | $9,326 | $810,010 | $314,000 | $496,010 |
| 2024 | $9,326 | $805,010 | $309,000 | $496,010 |
| 2023 | $8,542 | $756,930 | $289,000 | $467,930 |
| 2022 | $7,916 | $692,270 | $259,000 | $433,270 |
| 2021 | $0 | $619,330 | $229,000 | $390,330 |
| 2020 | $7,971 | $599,330 | $209,000 | $390,330 |
| 2019 | $6,832 | $577,240 | $209,000 | $368,240 |
| 2018 | $6,638 | $577,240 | $209,000 | $368,240 |
| 2017 | $6,609 | $569,240 | $201,000 | $368,240 |
| 2016 | $6,562 | $566,380 | $195,000 | $371,380 |
| 2015 | $6,321 | $566,380 | $195,000 | $371,380 |
| 2014 | $5,799 | $520,770 | $195,000 | $325,770 |
Source: Public Records
Map
Nearby Homes
- 3314 Woodburn Village Dr Unit 13
- 3322 Woodburn Village Dr Unit 13
- 3371 Breckenridge Ct
- 3331 Webley Ct
- 8316 Tobin Rd Unit 8316-11
- 8302 Tobin Rd Unit 11
- 8300 Tobin Rd Unit 34
- 8300 Tobin Rd Unit 23
- 3134 Prosperity Ave
- 8105 Gale St
- 3436 Holly Rd
- 8065 Nicosh Circle Ln Unit 55
- 8085 Gatehouse Rd Unit 4
- 8058 Genea Way Unit 48
- 8803 Lynnhurst Dr
- 3003 Nicosh Cir Unit 3106
- 7822 Holmes Run Dr
- 3021 Nicosh Cir Unit 1108
- 2909 Charing Cross Rd Unit 12
- 2907 Charing Cross Rd Unit 14
- 3340 Happy Heart Ln
- 3336 Happy Heart Ln
- 8455 Brass Knob Ct
- 8457 Brass Knob Ct
- 3334 Happy Heart Ln
- 3341 Happy Heart Ln
- 3343 Monarch Ln
- 3339 Happy Heart Ln
- 3343 Happy Heart Ln
- 3341 Monarch Ln
- 8453 Brass Knob Ct
- 3337 Happy Heart Ln
- 8459 Brass Knob Ct
- 3339 Monarch Ln
- 3345 Happy Heart Ln
- 8451 Brass Knob Ct
- 3335 Happy Heart Ln
- 3351 Monarch Ln
- 3333 Happy Heart Ln
- 3337 Monarch Ln