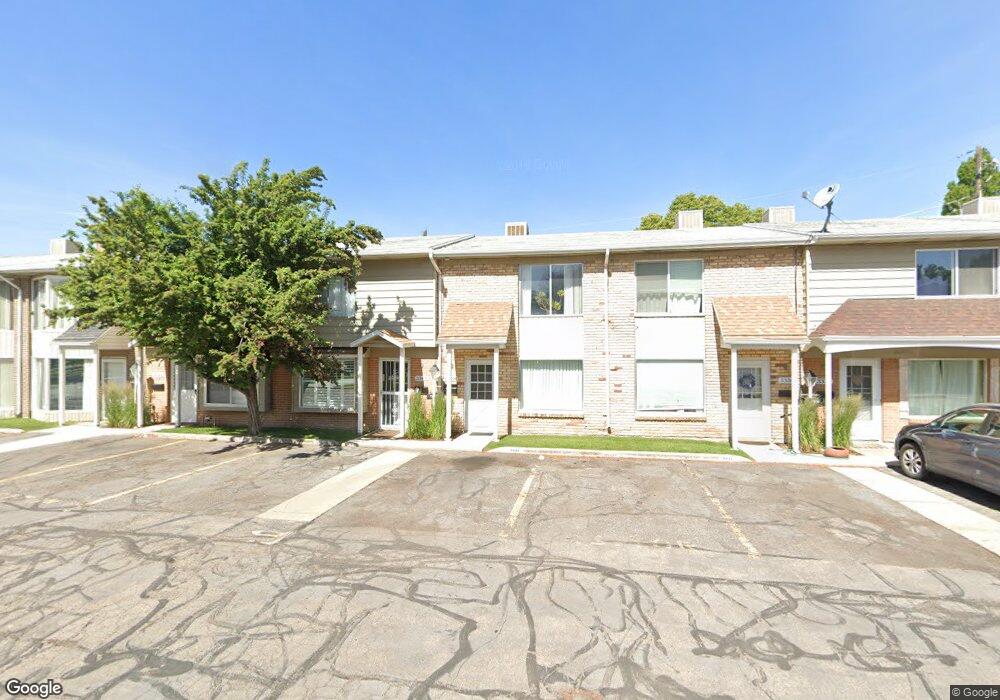
3338 S Georgetown Square Unit Bldg A Salt Lake City, UT 84109
East Millcreek NeighborhoodEstimated Value: $298,000 - $344,000
1
Bed
2
Baths
790
Sq Ft
$399/Sq Ft
Est. Value
About This Home
This home is located at 3338 S Georgetown Square Unit Bldg A, Salt Lake City, UT 84109 and is currently estimated at $315,085, approximately $398 per square foot. 3338 S Georgetown Square Unit Bldg A is a home located in Salt Lake County with nearby schools including William Penn Elementary School, Evergreen Junior High School, and Olympus High School.
Ownership History
Date
Name
Owned For
Owner Type
Purchase Details
Closed on
Jan 7, 2010
Sold by
Fischer Daniel S and Lelanuja Marissa R
Bought by
Townsend Johnny Edwin
Current Estimated Value
Home Financials for this Owner
Home Financials are based on the most recent Mortgage that was taken out on this home.
Original Mortgage
$96,224
Outstanding Balance
$62,629
Interest Rate
4.78%
Mortgage Type
FHA
Estimated Equity
$252,456
Purchase Details
Closed on
Feb 23, 2006
Sold by
Westbury Irene
Bought by
Fischer Daniel S and Lelanuja Marissa R
Home Financials for this Owner
Home Financials are based on the most recent Mortgage that was taken out on this home.
Original Mortgage
$77,779
Interest Rate
6.15%
Mortgage Type
FHA
Create a Home Valuation Report for This Property
The Home Valuation Report is an in-depth analysis detailing your home's value as well as a comparison with similar homes in the area
Home Values in the Area
Average Home Value in this Area
Purchase History
| Date | Buyer | Sale Price | Title Company |
|---|---|---|---|
| Townsend Johnny Edwin | -- | First American Title | |
| Fischer Daniel S | -- | 1St Natl Title Ins Agency |
Source: Public Records
Mortgage History
| Date | Status | Borrower | Loan Amount |
|---|---|---|---|
| Open | Townsend Johnny Edwin | $96,224 | |
| Closed | Townsend Johnny Edwin | $4,462 | |
| Previous Owner | Fischer Daniel S | $77,779 |
Source: Public Records
Tax History Compared to Growth
Tax History
| Year | Tax Paid | Tax Assessment Tax Assessment Total Assessment is a certain percentage of the fair market value that is determined by local assessors to be the total taxable value of land and additions on the property. | Land | Improvement |
|---|---|---|---|---|
| 2025 | $1,468 | $254,400 | $76,300 | $178,100 |
| 2024 | $1,468 | $267,000 | $80,100 | $186,900 |
| 2023 | $1,680 | $259,700 | $77,900 | $181,800 |
| 2022 | $1,698 | $263,800 | $79,100 | $184,700 |
| 2021 | $1,576 | $212,300 | $63,700 | $148,600 |
| 2020 | $1,356 | $172,400 | $51,700 | $120,700 |
| 2019 | $1,311 | $162,800 | $48,800 | $114,000 |
| 2018 | $1,168 | $139,700 | $41,900 | $97,800 |
| 2017 | $974 | $122,100 | $36,600 | $85,500 |
| 2016 | $906 | $114,600 | $34,400 | $80,200 |
| 2015 | $921 | $109,100 | $32,700 | $76,400 |
| 2014 | $933 | $108,000 | $32,400 | $75,600 |
Source: Public Records
Map
Nearby Homes
- 2070 E 3335 S Unit 32
- 2070 E 3335 S Unit 13
- 2129 E Georgetown Square
- 3404 S 2130 E
- 2150 E 3205 S
- 2215 E 3205 S
- 1977 E Millbrook Dr
- 2193 E Lambourne Ave Unit 3
- 2272 E 3380 S
- 2346 E 3395 S
- 3094 S 2300 E
- 3129 S 1810 E
- 1805 E 3170 S
- 3420 S Pioneer St
- 1839 E Honeybrook Place
- 2341 E Neffs Ln
- 2066 Sierra Ridge Ct
- 1752 E Millcreek Cir
- 1700 E 3300 S
- 2221 E Fisher Ln
- 3338 S Georgetown Square
- 3336 S Georgetown Square
- 3338 S Georgetown Square
- 3336 S Georgetown Square
- 3334 S Georgetown Square
- 3332 S Georgetown Square
- 3344 S Georgetown Square
- 3344 S Georgetown Square
- 2116 E Georgetown Square Unit C
- 2116 Georgetown Square
- 2111 Georgetown Square
- 3346 S Georgetown Square Unit 3346
- 3346 S Georgetown Square W Unit 3346
- 3348 S Georgetown Square
- 2121 E Georgetown Square
- 2121 Georgetown Square
- 2117 Georgetown Square
- 2112 E Georgetown Square Unit BLDG C
- 2112 E Georgetown Square
- 2112 Georgetown Square