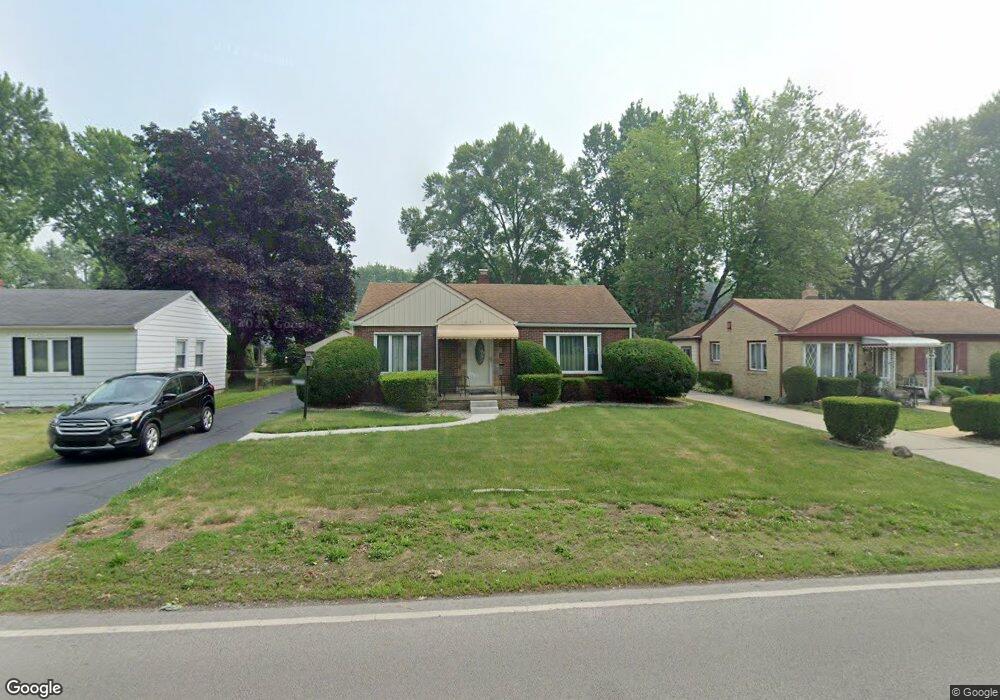
3339 Schneider Rd Toledo, OH 43614
Glendale-Heatherdowns NeighborhoodEstimated Value: $147,000 - $169,000
3
Beds
1
Bath
1,044
Sq Ft
$151/Sq Ft
Est. Value
About This Home
This home is located at 3339 Schneider Rd, Toledo, OH 43614 and is currently estimated at $157,586, approximately $150 per square foot. 3339 Schneider Rd is a home located in Lucas County with nearby schools including Byrnedale Elementary School, Bowsher High School, and St. Patrick of Heatherdowns School.
Ownership History
Date
Name
Owned For
Owner Type
Purchase Details
Closed on
Apr 20, 2001
Sold by
Kennedy James T
Bought by
Brazier Cynthia K
Current Estimated Value
Home Financials for this Owner
Home Financials are based on the most recent Mortgage that was taken out on this home.
Original Mortgage
$92,625
Outstanding Balance
$34,221
Interest Rate
7.05%
Estimated Equity
$123,365
Purchase Details
Closed on
Jan 29, 1999
Sold by
French James J and French Beverly L
Bought by
Kennedy James T
Home Financials for this Owner
Home Financials are based on the most recent Mortgage that was taken out on this home.
Original Mortgage
$78,885
Interest Rate
6.81%
Mortgage Type
FHA
Purchase Details
Closed on
Jun 17, 1994
Sold by
Est Mary J Leedy Jr
Bought by
French James J and French Beverly L
Home Financials for this Owner
Home Financials are based on the most recent Mortgage that was taken out on this home.
Original Mortgage
$61,200
Interest Rate
8.58%
Mortgage Type
New Conventional
Create a Home Valuation Report for This Property
The Home Valuation Report is an in-depth analysis detailing your home's value as well as a comparison with similar homes in the area
Home Values in the Area
Average Home Value in this Area
Purchase History
| Date | Buyer | Sale Price | Title Company |
|---|---|---|---|
| Brazier Cynthia K | $97,600 | -- | |
| Kennedy James T | $79,000 | -- | |
| French James J | $68,000 | -- |
Source: Public Records
Mortgage History
| Date | Status | Borrower | Loan Amount |
|---|---|---|---|
| Open | Brazier Cynthia K | $92,625 | |
| Previous Owner | Kennedy James T | $78,885 | |
| Previous Owner | French James J | $61,200 |
Source: Public Records
Tax History Compared to Growth
Tax History
| Year | Tax Paid | Tax Assessment Tax Assessment Total Assessment is a certain percentage of the fair market value that is determined by local assessors to be the total taxable value of land and additions on the property. | Land | Improvement |
|---|---|---|---|---|
| 2024 | $1,167 | $37,030 | $6,755 | $30,275 |
| 2023 | $2,117 | $32,025 | $5,915 | $26,110 |
| 2022 | $2,102 | $32,025 | $5,915 | $26,110 |
| 2021 | $2,173 | $32,025 | $5,915 | $26,110 |
| 2020 | $2,048 | $26,285 | $4,865 | $21,420 |
| 2019 | $1,980 | $26,285 | $4,865 | $21,420 |
| 2018 | $1,987 | $26,285 | $4,865 | $21,420 |
| 2017 | $1,890 | $23,975 | $6,790 | $17,185 |
| 2016 | $1,899 | $68,500 | $19,400 | $49,100 |
| 2015 | $1,911 | $68,500 | $19,400 | $49,100 |
| 2014 | $1,508 | $23,980 | $6,790 | $17,190 |
| 2013 | $1,508 | $23,980 | $6,790 | $17,190 |
Source: Public Records
Map
Nearby Homes
- 1848 Brierheath Ave
- 1629 Carmelle Ct
- 3118 Muirfield Ave
- 3042 Schneider Rd
- 3042 Cragmoor Ave
- 3157 Strathmoor Ave
- 3729 Linden Green Dr
- 1953 Heatherlawn Dr
- 3546 Denise Dr
- 1518 Wilmore Dr
- 3133 Glencairn Ave
- 2921 Schneider Rd
- 1919 Colony Dr
- 3148 Glanzman Rd
- 3651 Treelawn Dr
- 3813 Glendale Ave
- 3607 Roberta Dr
- 2134 Tedrow Rd
- 1912 Glencairn Ave
- 3679 Elmlawn Dr
- 3331 Schneider Rd
- 3403 Schneider Rd
- 3327 Schneider Rd
- 3407 Schneider Rd
- 3340 Muirfield Ave
- 3330 Muirfield Ave
- 3404 Muirfield Ave
- 3411 Schneider Rd
- 3319 Schneider Rd
- 3324 Muirfield Ave
- 3412 Muirfield Ave
- 3419 Schneider Rd
- 3315 Schneider Rd
- 3318 Muirfield Ave
- 3405 Muirfield Ave
- 3423 Schneider Rd
- 3307 Schneider Rd
- 3401 Radisson Ave
- 3310 Muirfield Ave
- 3315 Muirfield Ave