
Seller's Agent in 2014
Janet Martin
Keller Williams Citywide
(440) 281-0125
Estimated Value: $509,511 - $516,000
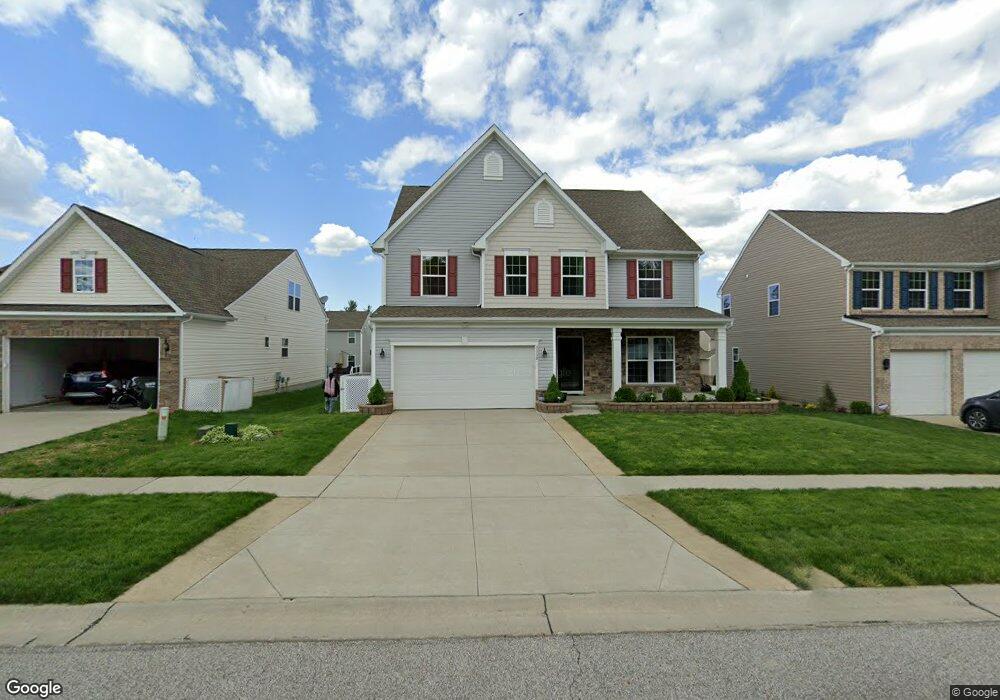
This Naples offers plenty of space for family and entertaining. Outside admire the upgraded partial stone façade, complete with 2-car garage. Enter into the foyer that leads to the formal living room, formal dining room and powder room and easy access to the open kitchen. The gourmet kitchen provides maple cabinetry, a walk-in pantry, granite countertops, stainless steel appliances, recessed lighting, a sunny morning room and a gourmet island. Upstairs there are 4 spacious bedrooms and loft, a full bath with maples cabinetry and 2 sinks and a second floor laundry room. The owner’s suite has a large walk-in closet, a luxurious owner’s bath with separate tub and shower, double vanity and ceramic tile surround. Additional living space is also included in the finished basement! Our 100% Energy Star Certified homes save you up to 30% on your utility bills and a comprehensive warranty package offers peace of mind. Photos for illustration purposes only. To be built.
| Date | Buyer | Sale Price | Title Company |
|---|---|---|---|
| Nvr Inc | $58,000 | Nvr Title Agency Llc |
| Date | Event | Price | List to Sale | Price per Sq Ft | Prior Sale |
|---|---|---|---|---|---|
| 09/25/2014 09/25/14 | Sold | $309,190 | +6.4% | $106 / Sq Ft | View Prior Sale |
| 05/19/2014 05/19/14 | Pending | -- | -- | -- | |
| 05/14/2014 05/14/14 | For Sale | $290,710 | -- | $100 / Sq Ft |
| Year | Tax Paid | Tax Assessment Tax Assessment Total Assessment is a certain percentage of the fair market value that is determined by local assessors to be the total taxable value of land and additions on the property. | Land | Improvement |
|---|---|---|---|---|
| 2025 | $7,737 | $153,437 | $22,414 | $131,023 |
| 2024 | $7,737 | $153,437 | $22,414 | $131,023 |
| 2023 | $7,737 | $153,437 | $22,414 | $131,023 |
| 2022 | $6,995 | $124,748 | $18,225 | $106,523 |
| 2021 | $7,027 | $124,748 | $18,225 | $106,523 |
| 2020 | $7,112 | $124,750 | $18,230 | $106,520 |
| 2019 | $6,280 | $102,480 | $18,230 | $84,250 |
| 2018 | $6,165 | $102,480 | $18,230 | $84,250 |
| 2017 | $5,798 | $102,480 | $18,230 | $84,250 |
| 2016 | $5,764 | $102,480 | $18,230 | $84,250 |
| 2015 | $5,798 | $102,480 | $18,230 | $84,250 |
| 2014 | $1,107 | $18,230 | $18,230 | $0 |
| 2013 | $90 | $520 | $520 | $0 |
Seller's Agent in 2014
Janet Martin
Keller Williams Citywide
(440) 281-0125
N
Buyer's Agent in 2014
Non-Member Non-Member
Non-Member