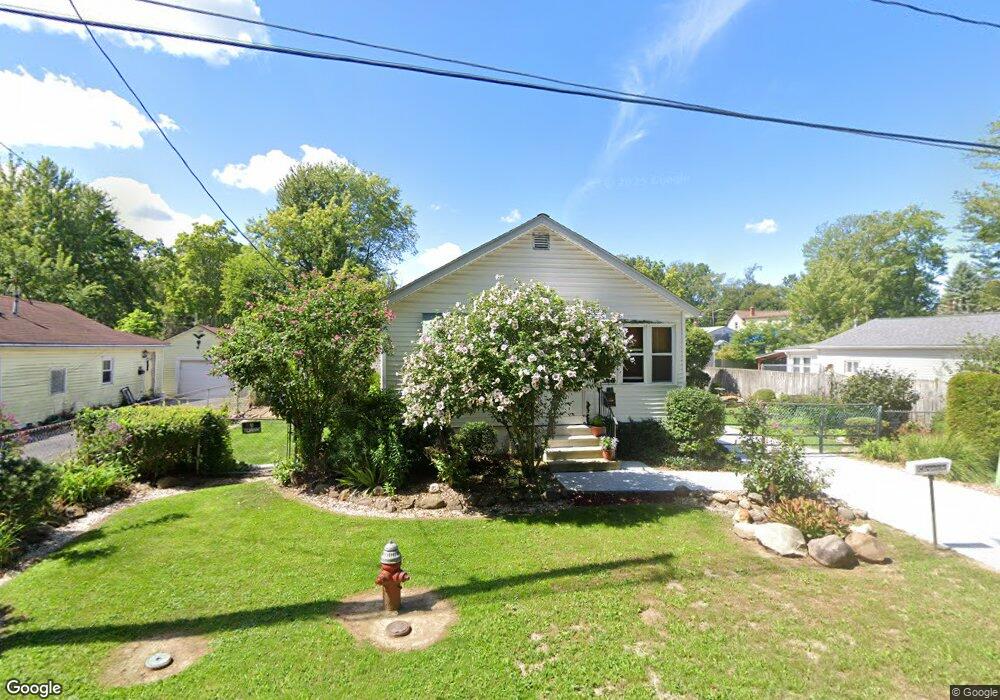
334 Broadway St Amherst, OH 44001
Estimated Value: $111,000 - $219,000
2
Beds
1
Bath
891
Sq Ft
$177/Sq Ft
Est. Value
About This Home
This home is located at 334 Broadway St, Amherst, OH 44001 and is currently estimated at $157,791, approximately $177 per square foot. 334 Broadway St is a home located in Lorain County with nearby schools including Powers Elementary School, Walter G. Nord Middle School, and Amherst Junior High School.
Ownership History
Date
Name
Owned For
Owner Type
Purchase Details
Closed on
Jan 9, 2017
Sold by
Mazanek Jesse J
Bought by
Mazanek Nancy M and White Katrina A
Current Estimated Value
Purchase Details
Closed on
Feb 15, 2005
Sold by
Southwest Properties Inc
Bought by
Mazanek Jesse J
Home Financials for this Owner
Home Financials are based on the most recent Mortgage that was taken out on this home.
Original Mortgage
$98,800
Outstanding Balance
$50,384
Interest Rate
5.8%
Mortgage Type
Purchase Money Mortgage
Estimated Equity
$107,407
Purchase Details
Closed on
Jan 22, 2004
Sold by
Riddle Robert D
Bought by
Southwest Properties Inc
Purchase Details
Closed on
Mar 10, 2000
Sold by
Januzzi Thomas A and Hand Grover G
Bought by
Riddle Robert D
Home Financials for this Owner
Home Financials are based on the most recent Mortgage that was taken out on this home.
Original Mortgage
$45,000
Interest Rate
8.26%
Create a Home Valuation Report for This Property
The Home Valuation Report is an in-depth analysis detailing your home's value as well as a comparison with similar homes in the area
Home Values in the Area
Average Home Value in this Area
Purchase History
| Date | Buyer | Sale Price | Title Company |
|---|---|---|---|
| Mazanek Nancy M | -- | -- | |
| Mazanek Jesse J | $104,000 | Sandstone Title Agency Ltd | |
| Southwest Properties Inc | $70,000 | Real Living Title Agency Ltd | |
| Riddle Robert D | $60,000 | Lorain County Title Co Inc |
Source: Public Records
Mortgage History
| Date | Status | Borrower | Loan Amount |
|---|---|---|---|
| Open | Mazanek Jesse J | $98,800 | |
| Previous Owner | Riddle Robert D | $45,000 |
Source: Public Records
Tax History
| Year | Tax Paid | Tax Assessment Tax Assessment Total Assessment is a certain percentage of the fair market value that is determined by local assessors to be the total taxable value of land and additions on the property. | Land | Improvement |
|---|---|---|---|---|
| 2024 | $379 | $8,008 | $3,462 | $4,547 |
| 2023 | $434 | $7,847 | $5,128 | $2,720 |
| 2022 | $417 | $7,847 | $5,128 | $2,720 |
| 2021 | $416 | $7,847 | $5,128 | $2,720 |
| 2020 | $383 | $6,370 | $4,160 | $2,210 |
| 2019 | $375 | $6,370 | $4,160 | $2,210 |
| 2018 | $376 | $6,370 | $4,160 | $2,210 |
| 2017 | $344 | $5,510 | $4,320 | $1,190 |
| 2016 | $345 | $5,510 | $4,320 | $1,190 |
| 2015 | $343 | $5,510 | $4,320 | $1,190 |
| 2014 | -- | $5,300 | $4,160 | $1,140 |
| 2013 | $1,054 | $18,470 | $4,610 | $13,860 |
Source: Public Records
Map
Nearby Homes
- 774 Tenney Ave
- 145 Pearl St
- 653 Brennan Dr
- 2176 Myla Way
- 0 Middle Ridge Rd Unit 5180506
- 0 Middle Ridge Rd Unit 5102632
- 495 Church St
- 7475 S Dewey Rd
- 937 Longitude Ln
- 107 Keswick Ct
- 472 Sunset Dr
- 812 Bearing Ct
- 953 Longitude Ln
- V/L Middle Ridge Rd
- 437 Rock Creek Run
- 267 Milan Ave
- 6501 Fox Tail Ln
- 707 Lincoln St
- 116 Rockridge Dr
- 578 N Main St
- 334 Broadway St
- 340 Broadway St
- 328 Broadway St
- 323 Taylor St
- 346 Broadway St
- 320 Broadway St
- 320 Broadway St
- 320 Broadway St
- 320 Broadway St
- 317 Taylor St
- 352 Broadway St
- 311 Taylor St
- 307 Taylor St
- 307 Taylor St
- 337 Taylor St
- 343 Taylor St
- 1071 Tenney Ave
- 358 Broadway St
- 318 Taylor St
- 322 Taylor St
Your Personal Tour Guide
Ask me questions while you tour the home.