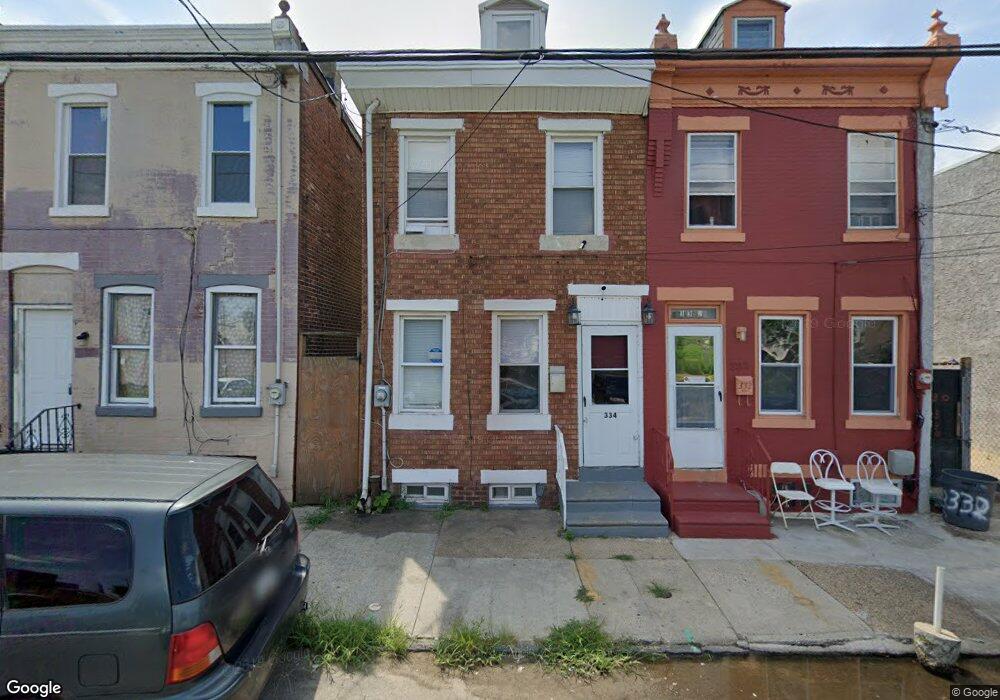
334 Cherry St Camden, NJ 08103
Bergen Square NeighborhoodEstimated Value: $100,000 - $184,000
3
Beds
1
Bath
1,274
Sq Ft
$112/Sq Ft
Est. Value
About This Home
This home is located at 334 Cherry St, Camden, NJ 08103 and is currently estimated at $142,247, approximately $111 per square foot. 334 Cherry St is a home located in Camden County with nearby schools including Camden High School, Hope Community Charter School, and Leap Academy University Charter School.
Ownership History
Date
Name
Owned For
Owner Type
Purchase Details
Closed on
Mar 26, 2012
Sold by
Cerini Joseph
Bought by
Victoria Investment Propetries Llc
Current Estimated Value
Purchase Details
Closed on
Dec 10, 2010
Sold by
Kondaur Capital Corp
Bought by
Cerini Joseph
Purchase Details
Closed on
May 10, 2010
Sold by
Green Michael and Green Alvinette
Bought by
Kondaur Capital Corp
Purchase Details
Closed on
Aug 31, 2006
Sold by
Trump Jennifer
Bought by
Green Michael and Green Alvinette
Home Financials for this Owner
Home Financials are based on the most recent Mortgage that was taken out on this home.
Original Mortgage
$79,800
Interest Rate
6.59%
Purchase Details
Closed on
Nov 10, 2000
Sold by
Lopez Jose R
Bought by
Trump Jennifer
Home Financials for this Owner
Home Financials are based on the most recent Mortgage that was taken out on this home.
Original Mortgage
$33,557
Interest Rate
7.78%
Create a Home Valuation Report for This Property
The Home Valuation Report is an in-depth analysis detailing your home's value as well as a comparison with similar homes in the area
Home Values in the Area
Average Home Value in this Area
Purchase History
| Date | Buyer | Sale Price | Title Company |
|---|---|---|---|
| Victoria Investment Propetries Llc | -- | None Available | |
| Cerini Joseph | $20,000 | -- | |
| Kondaur Capital Corp | $30,000 | -- | |
| Green Michael | $84,000 | -- | |
| Trump Jennifer | $34,000 | -- |
Source: Public Records
Mortgage History
| Date | Status | Borrower | Loan Amount |
|---|---|---|---|
| Previous Owner | Green Michael | $79,800 | |
| Previous Owner | Trump Jennifer | $33,557 |
Source: Public Records
Tax History
| Year | Tax Paid | Tax Assessment Tax Assessment Total Assessment is a certain percentage of the fair market value that is determined by local assessors to be the total taxable value of land and additions on the property. | Land | Improvement |
|---|---|---|---|---|
| 2025 | $1,190 | $33,600 | $5,500 | $28,100 |
| 2024 | $1,151 | $33,600 | $5,500 | $28,100 |
| 2023 | $1,151 | $33,600 | $5,500 | $28,100 |
| 2022 | $1,129 | $33,600 | $5,500 | $28,100 |
| 2021 | $1,125 | $33,600 | $5,500 | $28,100 |
| 2020 | $1,068 | $33,600 | $5,500 | $28,100 |
| 2019 | $1,023 | $33,600 | $5,500 | $28,100 |
| 2018 | $1,018 | $33,600 | $5,500 | $28,100 |
| 2017 | $993 | $33,600 | $5,500 | $28,100 |
| 2016 | $961 | $33,600 | $5,500 | $28,100 |
| 2015 | $925 | $33,600 | $5,500 | $28,100 |
| 2014 | $903 | $33,600 | $5,500 | $28,100 |
Source: Public Records
Map
Nearby Homes
Your Personal Tour Guide
Ask me questions while you tour the home.