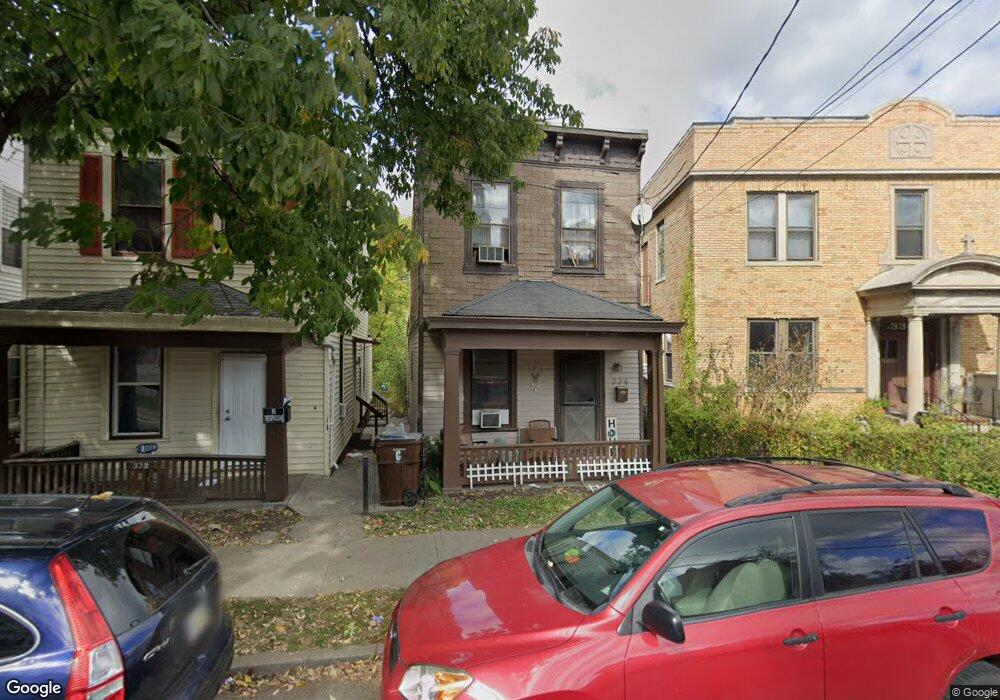
334 E 16th St Covington, KY 41014
Austinburg NeighborhoodEstimated Value: $140,000 - $168,000
2
Beds
2
Baths
1,416
Sq Ft
$109/Sq Ft
Est. Value
About This Home
This home is located at 334 E 16th St, Covington, KY 41014 and is currently estimated at $154,801, approximately $109 per square foot. 334 E 16th St is a home located in Kenton County with nearby schools including Holmes High School, Saint Augustine Catholic School, and Covington Latin School.
Ownership History
Date
Name
Owned For
Owner Type
Purchase Details
Closed on
Aug 27, 2007
Sold by
Hruby Julie
Bought by
Thompson Rachel A
Current Estimated Value
Home Financials for this Owner
Home Financials are based on the most recent Mortgage that was taken out on this home.
Original Mortgage
$5,000
Interest Rate
6.65%
Mortgage Type
Unknown
Purchase Details
Closed on
Sep 13, 1999
Sold by
Nguyen Dung
Bought by
Hruby Julie
Purchase Details
Closed on
Apr 2, 1996
Sold by
Vu Duc Thanh
Bought by
Nguyen Nhung T and Nguyen Dung V
Home Financials for this Owner
Home Financials are based on the most recent Mortgage that was taken out on this home.
Original Mortgage
$21,600
Interest Rate
6.9%
Mortgage Type
New Conventional
Create a Home Valuation Report for This Property
The Home Valuation Report is an in-depth analysis detailing your home's value as well as a comparison with similar homes in the area
Home Values in the Area
Average Home Value in this Area
Purchase History
| Date | Buyer | Sale Price | Title Company |
|---|---|---|---|
| Thompson Rachel A | $55,900 | Old National Title Llc | |
| Hruby Julie | $39,000 | -- | |
| Nguyen Nhung T | $15,000 | -- |
Source: Public Records
Mortgage History
| Date | Status | Borrower | Loan Amount |
|---|---|---|---|
| Closed | Thompson Rachel A | $5,000 | |
| Open | Thompson Rachel A | $51,663 | |
| Previous Owner | Nguyen Nhung T | $21,600 |
Source: Public Records
Tax History
| Year | Tax Paid | Tax Assessment Tax Assessment Total Assessment is a certain percentage of the fair market value that is determined by local assessors to be the total taxable value of land and additions on the property. | Land | Improvement |
|---|---|---|---|---|
| 2025 | $1,207 | $91,100 | $5,000 | $86,100 |
| 2024 | $1,198 | $91,100 | $5,000 | $86,100 |
| 2023 | $1,213 | $91,100 | $5,000 | $86,100 |
| 2022 | $1,254 | $91,100 | $5,000 | $86,100 |
| 2021 | $911 | $55,900 | $5,000 | $50,900 |
| 2020 | $906 | $55,900 | $5,000 | $50,900 |
| 2019 | $916 | $55,900 | $5,000 | $50,900 |
| 2018 | $934 | $55,900 | $5,000 | $50,900 |
| 2017 | $947 | $55,900 | $6,000 | $49,900 |
| 2015 | $1,414 | $55,900 | $6,000 | $49,900 |
| 2014 | $1,241 | $55,900 | $6,000 | $49,900 |
Source: Public Records
Map
Nearby Homes
- 326 E 16th St
- 326 E 17th St
- 401 Oliver St
- 403 Oliver St
- 1720 Garrard St
- 401-03 Oliver St
- 1619 Greenup St
- 1413 Kendall St
- 1505 Greenup St
- 614 E 16th St
- 336 Byrd St
- 1406 Greenup St
- 1814 Eastern Ave
- 1410 Scott St
- 1904 Greenup St
- 1510 Wheeler St
- 209 Pleasant St
- 16 E 18th St
- 25 E 20th St
- 515 Delmar Place
Your Personal Tour Guide
Ask me questions while you tour the home.