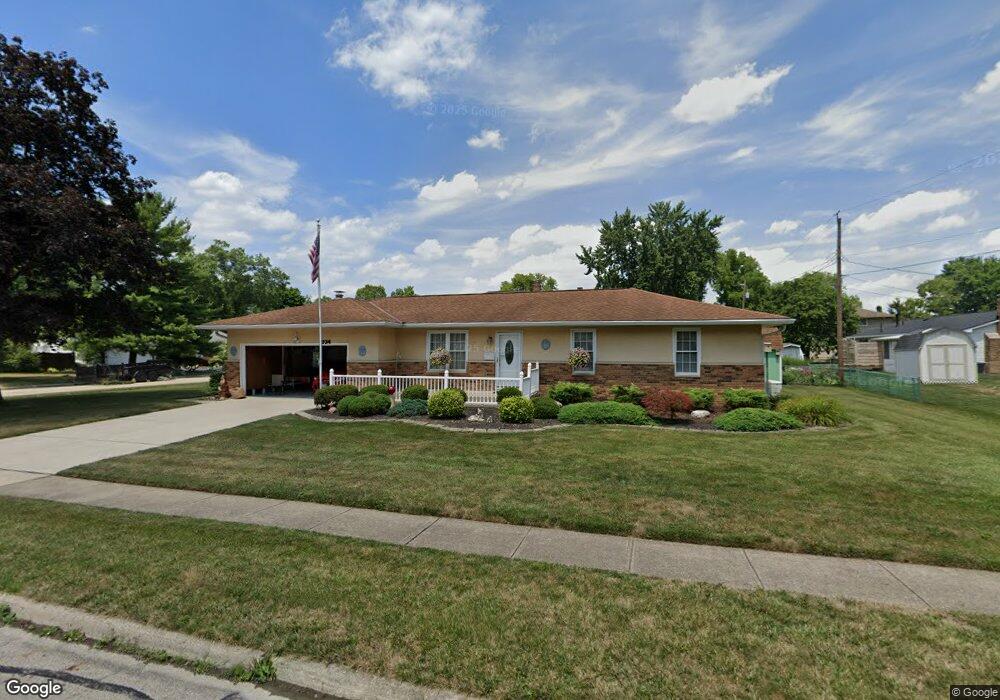
334 Finstock Way Columbus, OH 43230
Estimated Value: $323,000 - $398,000
3
Beds
2
Baths
1,488
Sq Ft
$244/Sq Ft
Est. Value
About This Home
This home is located at 334 Finstock Way, Columbus, OH 43230 and is currently estimated at $363,479, approximately $244 per square foot. 334 Finstock Way is a home located in Franklin County with nearby schools including Jefferson Elementary School, Gahanna East Middle School, and Lincoln High School.
Ownership History
Date
Name
Owned For
Owner Type
Purchase Details
Closed on
Jan 9, 2008
Sold by
Shrigley Juliann and Shrigley Michael J
Bought by
Shrigley Michael J and Shrigley Juliann
Current Estimated Value
Purchase Details
Closed on
Sep 8, 2007
Sold by
Fisher Harold O
Bought by
Fisher Ryznar Joan Fisher and Fisher Shrigley Julianne
Purchase Details
Closed on
Aug 27, 2003
Sold by
Blunt Fisher Harold O and Blunt Smith Ethel
Bought by
Fisher Harold O and Harold O Fisher Trust
Purchase Details
Closed on
Nov 6, 1999
Sold by
Fisher Harold O
Bought by
Fisher Harold O
Purchase Details
Closed on
Jul 16, 1996
Sold by
Carla S Tatum Trst
Bought by
Harold O Fisher
Purchase Details
Closed on
Mar 1, 1978
Create a Home Valuation Report for This Property
The Home Valuation Report is an in-depth analysis detailing your home's value as well as a comparison with similar homes in the area
Home Values in the Area
Average Home Value in this Area
Purchase History
| Date | Buyer | Sale Price | Title Company |
|---|---|---|---|
| Shrigley Michael J | -- | Attorney | |
| Fisher Ryznar Joan Fisher | -- | Attorney | |
| Fisher Harold O | -- | -- | |
| Fisher Harold O | -- | -- | |
| Fisher Harold O | -- | -- | |
| Harold O Fisher | $121,900 | -- | |
| -- | $51,000 | -- |
Source: Public Records
Tax History Compared to Growth
Tax History
| Year | Tax Paid | Tax Assessment Tax Assessment Total Assessment is a certain percentage of the fair market value that is determined by local assessors to be the total taxable value of land and additions on the property. | Land | Improvement |
|---|---|---|---|---|
| 2024 | $6,439 | $107,140 | $35,000 | $72,140 |
| 2023 | $6,360 | $107,135 | $35,000 | $72,135 |
| 2022 | $5,528 | $72,530 | $12,780 | $59,750 |
| 2021 | $5,350 | $72,530 | $12,780 | $59,750 |
| 2020 | $5,307 | $72,530 | $12,780 | $59,750 |
| 2019 | $4,506 | $61,250 | $10,640 | $50,610 |
| 2018 | $2,238 | $61,250 | $10,640 | $50,610 |
| 2017 | $4,146 | $61,250 | $10,640 | $50,610 |
| 2016 | $3,867 | $52,020 | $15,090 | $36,930 |
| 2015 | $1,935 | $52,020 | $15,090 | $36,930 |
| 2014 | $3,840 | $52,020 | $15,090 | $36,930 |
| 2013 | $1,881 | $51,275 | $14,350 | $36,925 |
Source: Public Records
Map
Nearby Homes
- 302 Zander Ln Unit 302
- 206 Lintner St
- 219 N Hamilton Rd
- 365 Sycamore Woods Ln Unit 365
- 211 Crossing Creek N
- 488 Three Oaks Ct Unit 488
- 641 Sycamore Mill Dr
- 657 Picadilly Ct
- 135 Serran Dr
- 148 Sierra Dr
- 108 Walcreek Dr W
- 183 Serran Dr
- 804 Riva Ridge Blvd
- 111 Nob Hill Dr N
- 638 Churchill Dr
- 642 Ridenour Rd
- 4220 E Johnstown Rd
- 321 Flint Ridge Dr
- 0 Beecher Crossing
- 745 Fleetrun Ave
- 400 Finstock Ct
- 387 Worman Dr
- 335 Finstock Way
- 316 Finstock Way
- 327 Finstock Way
- 399 Finstock Ct
- 371 Worman Dr
- 408 Finstock Ct
- 319 Finstock Way
- 409 Worman Dr
- 405 Finstock Ct
- 412 Finstock Ct
- 386 Worman Dr
- 326 Lyncroft Ct
- 311 Finstock Way
- 394 Worman Dr
- 304 Finstock Way
- 378 Worman Dr
- 361 Worman Dr
- 398 Lyncroft Dr