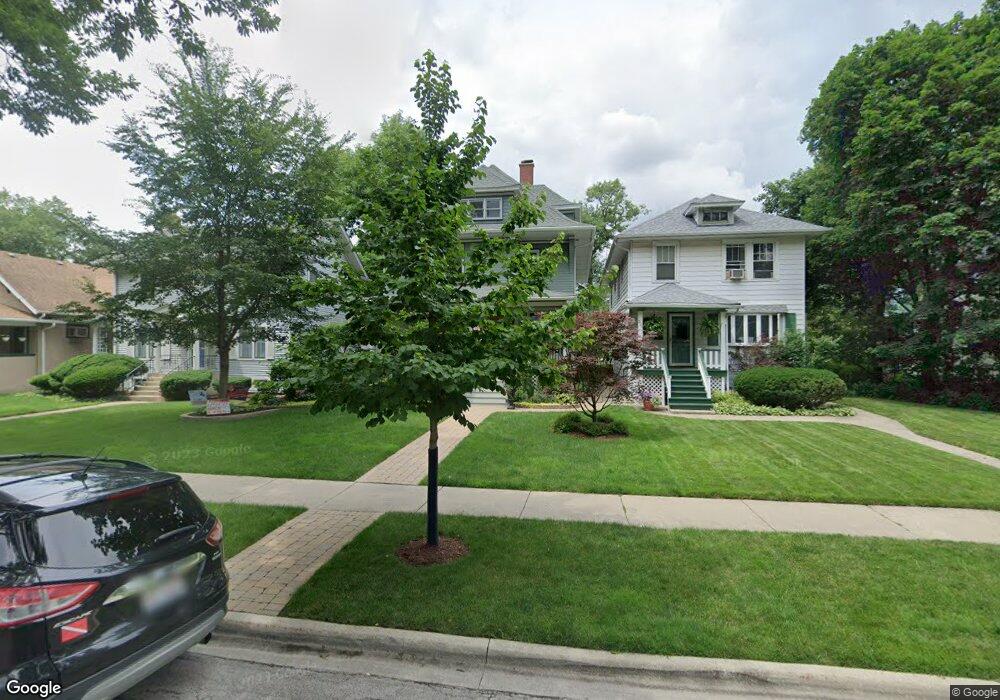
334 Franklin Ave River Forest, IL 60305
Estimated Value: $953,410 - $1,118,000
5
Beds
4
Baths
3,732
Sq Ft
$273/Sq Ft
Est. Value
About This Home
This home is located at 334 Franklin Ave, River Forest, IL 60305 and is currently estimated at $1,017,103, approximately $272 per square foot. 334 Franklin Ave is a home located in Cook County with nearby schools including Lincoln Elementary School, Roosevelt Middle School, and Oak Park and River Forest High School.
Ownership History
Date
Name
Owned For
Owner Type
Purchase Details
Closed on
May 23, 2013
Sold by
Grant Sheryl L and Grant Michael T
Bought by
Grant Sheryl L Trust and Sheryl L Grant Trust
Current Estimated Value
Purchase Details
Closed on
Nov 25, 1998
Sold by
Saleh Colleen P
Bought by
Grant Michael T and Grant Sheryl L
Home Financials for this Owner
Home Financials are based on the most recent Mortgage that was taken out on this home.
Original Mortgage
$296,000
Interest Rate
6.25%
Purchase Details
Closed on
May 31, 1996
Sold by
Sloger Louise E
Bought by
Saleh Colleen P
Home Financials for this Owner
Home Financials are based on the most recent Mortgage that was taken out on this home.
Original Mortgage
$159,300
Interest Rate
6.12%
Create a Home Valuation Report for This Property
The Home Valuation Report is an in-depth analysis detailing your home's value as well as a comparison with similar homes in the area
Home Values in the Area
Average Home Value in this Area
Purchase History
| Date | Buyer | Sale Price | Title Company |
|---|---|---|---|
| Grant Sheryl L Trust | -- | -- | |
| Grant Sheryl L Trust | -- | -- | |
| Sheryl L Grant Trust | -- | -- | |
| Grant Michael T | $370,000 | Prairie Title | |
| Saleh Colleen P | $177,000 | Prairie Title |
Source: Public Records
Mortgage History
| Date | Status | Borrower | Loan Amount |
|---|---|---|---|
| Previous Owner | Grant Michael T | $296,000 | |
| Previous Owner | Saleh Colleen P | $159,300 |
Source: Public Records
Tax History
| Year | Tax Paid | Tax Assessment Tax Assessment Total Assessment is a certain percentage of the fair market value that is determined by local assessors to be the total taxable value of land and additions on the property. | Land | Improvement |
|---|---|---|---|---|
| 2025 | $19,077 | $85,000 | $8,611 | $76,389 |
| 2024 | $19,077 | $73,000 | $8,611 | $64,389 |
| 2023 | $18,136 | $73,000 | $8,611 | $64,389 |
| 2022 | $18,136 | $59,584 | $7,409 | $52,175 |
| 2021 | $17,494 | $59,583 | $7,409 | $52,174 |
| 2020 | $17,163 | $59,583 | $7,409 | $52,174 |
| 2019 | $17,086 | $58,468 | $6,808 | $51,660 |
| 2018 | $16,173 | $58,468 | $6,808 | $51,660 |
| 2017 | $16,133 | $58,468 | $6,808 | $51,660 |
| 2016 | $14,709 | $48,219 | $5,607 | $42,612 |
| 2015 | $14,410 | $48,219 | $5,607 | $42,612 |
| 2014 | $13,215 | $48,219 | $5,607 | $42,612 |
| 2013 | $15,204 | $56,513 | $5,607 | $50,906 |
Source: Public Records
Map
Nearby Homes
- 411 Ashland Ave Unit 1A
- 424 Park Ave Unit 205
- 424 Park Ave Unit 204
- 424 Park Ave Unit 206
- 502 Park Ave Unit 502
- 7521 Brown Ave Unit G
- 310 Lathrop Ave Unit P52
- 7415 Dixon St
- 210 Des Plaines Ave Unit D
- 17 Franklin Ave
- 314 Lathrop Ave Unit 502
- 314 Lathrop Ave Unit 407
- 314 Lathrop Ave Unit 402
- 314 Lathrop Ave Unit 503
- 314 Lathrop Ave Unit 604
- 314 Lathrop Ave Unit 507
- 17 Ashland Ave
- 139 Thatcher Ave
- 315 Des Plaines Ave Unit 406
- 7449 Washington St Unit 206
- 328 Franklin Ave
- 346 Franklin Ave
- 348 Franklin Ave
- 320 Franklin Ave
- 339 Park Ave
- 333 Park Ave
- 329 Park Ave Unit 2FL
- 329 Park Ave
- 325 Park Ave
- 347 Park Ave
- 335 Franklin Ave
- 339 Franklin Ave
- 333 Franklin Ave
- 343 Park Ave
- 343 Franklin Ave
- 329 Franklin Ave
- 321 Park Ave
- 349 Park Ave
- 314 Franklin Ave
- 347 Franklin Ave
Your Personal Tour Guide
Ask me questions while you tour the home.