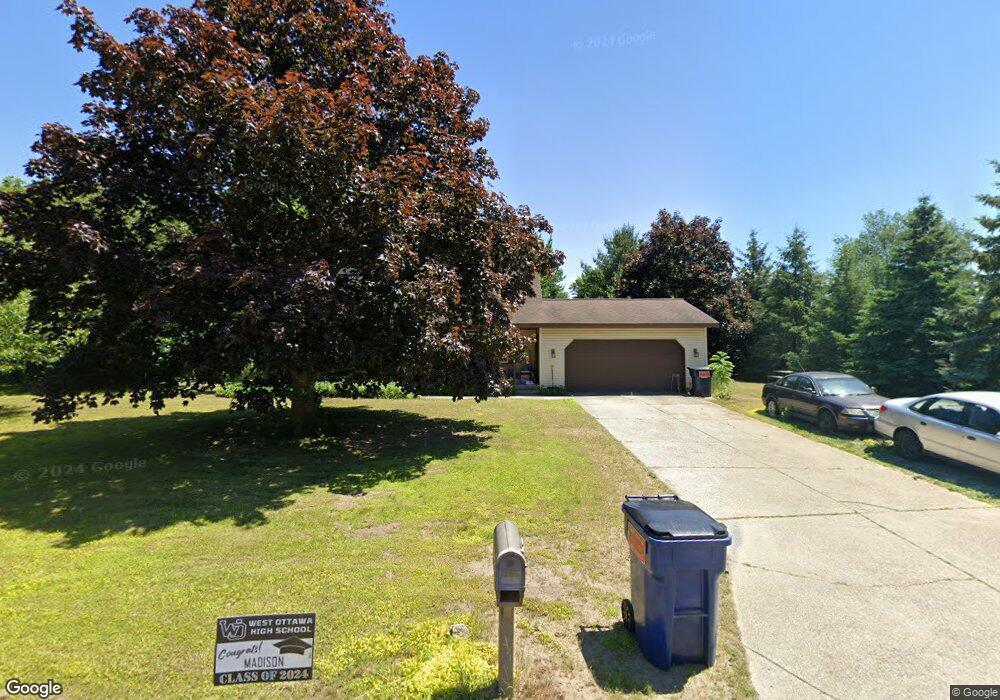
334 Franklin St Holland, MI 49424
Estimated Value: $321,000 - $376,000
5
Beds
2
Baths
1,475
Sq Ft
$236/Sq Ft
Est. Value
About This Home
This home is located at 334 Franklin St, Holland, MI 49424 and is currently estimated at $347,767, approximately $235 per square foot. 334 Franklin St is a home located in Ottawa County with nearby schools including Woodside Elementary School, Macatawa Bay Middle School, and West Ottawa High School.
Ownership History
Date
Name
Owned For
Owner Type
Purchase Details
Closed on
Dec 17, 2009
Sold by
Bouman Robert C and Bakker Sandra K
Bought by
Solis Avisahi
Current Estimated Value
Home Financials for this Owner
Home Financials are based on the most recent Mortgage that was taken out on this home.
Original Mortgage
$122,735
Outstanding Balance
$80,301
Interest Rate
4.96%
Mortgage Type
FHA
Estimated Equity
$267,466
Purchase Details
Closed on
Jan 5, 2004
Sold by
Bouman Robert C and Bakker Sandra K
Bought by
Bouman Robert C and Bakker Sandra K
Create a Home Valuation Report for This Property
The Home Valuation Report is an in-depth analysis detailing your home's value as well as a comparison with similar homes in the area
Home Values in the Area
Average Home Value in this Area
Purchase History
| Date | Buyer | Sale Price | Title Company |
|---|---|---|---|
| Solis Avisahi | $125,000 | Chicago Title | |
| Bouman Robert C | -- | -- |
Source: Public Records
Mortgage History
| Date | Status | Borrower | Loan Amount |
|---|---|---|---|
| Open | Solis Avisahi | $122,735 |
Source: Public Records
Tax History Compared to Growth
Tax History
| Year | Tax Paid | Tax Assessment Tax Assessment Total Assessment is a certain percentage of the fair market value that is determined by local assessors to be the total taxable value of land and additions on the property. | Land | Improvement |
|---|---|---|---|---|
| 2025 | $2,301 | $135,700 | $0 | $0 |
| 2024 | $1,743 | $135,900 | $0 | $0 |
| 2023 | $1,682 | $112,900 | $0 | $0 |
| 2022 | $2,161 | $90,900 | $0 | $0 |
| 2021 | $2,102 | $89,100 | $0 | $0 |
| 2020 | $2,027 | $81,200 | $0 | $0 |
| 2019 | $2,005 | $57,200 | $0 | $0 |
| 2018 | $1,850 | $72,700 | $15,500 | $57,200 |
| 2017 | $1,821 | $69,200 | $0 | $0 |
| 2016 | $1,812 | $64,000 | $0 | $0 |
| 2015 | $1,734 | $61,600 | $0 | $0 |
| 2014 | $1,734 | $57,400 | $0 | $0 |
Source: Public Records
Map
Nearby Homes
- 888 S Kingwood Ct
- 257 Mae Rose Ave
- 790 Mayfield Ave
- 1020 Katra Ln Unit 52
- 286 Felch St
- 901 Butternut Dr
- 125 Liberty St
- 961 Shadybrook Dr
- 785 Mary Ave
- 14159 Pheasant Run
- 13652 Signature Dr
- 13654 Signature Dr
- 14145 Carol St
- V/L Jack St
- 14298 Carol St
- 13182 Greenly St
- 490 James St
- 13748 Quincy St
- 13785 Quincy St
- Integrity 1610 Plan at Silverwater
- 324 Franklin St
- 899 Maywood Ave
- 908 Maywood Ave
- 896 Maywood Ave
- 333 Franklin St
- 915 Maywood Ave
- 329 Franklin St
- 893 Maywood Ave
- 922 Oakdale Ct
- 321 Franklin St
- 914 Maywood Ave
- 904 Oakdale Ct
- 888 Maywood Ave
- 898 Oakdale Ct
- 934 Oakdale Ct
- 885 Maywood Ave
- 923 Maywood Ave
- 924 Maywood Ave
- 883 S Kingwood Ct
- 880 Maywood Ave