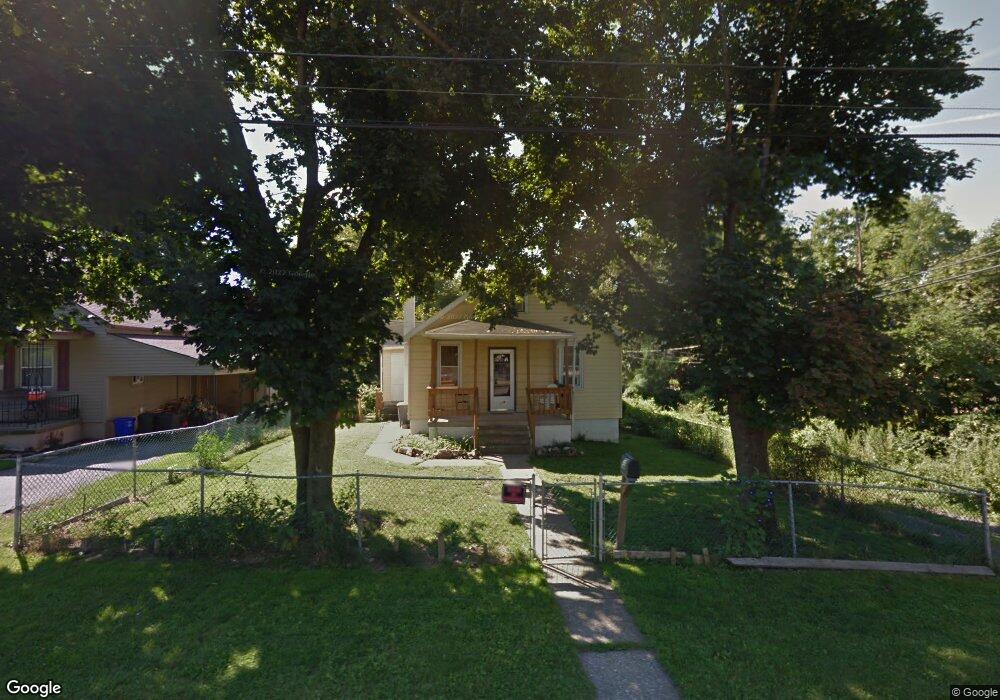
334 Fulton St Enola, PA 17025
East Pennsboro NeighborhoodEstimated Value: $170,000 - $190,422
2
Beds
1
Bath
1,101
Sq Ft
$166/Sq Ft
Est. Value
About This Home
This home is located at 334 Fulton St, Enola, PA 17025 and is currently estimated at $182,356, approximately $165 per square foot. 334 Fulton St is a home located in Cumberland County with nearby schools including East Pennsboro Area Middle School, East Pennsboro Area Senior High School, and Harrisburg Academy.
Ownership History
Date
Name
Owned For
Owner Type
Purchase Details
Closed on
Feb 27, 2025
Sold by
Bostdorf Dewey R
Bought by
Michaels Alexa E and Christiana Anthony M
Current Estimated Value
Home Financials for this Owner
Home Financials are based on the most recent Mortgage that was taken out on this home.
Original Mortgage
$9,000
Outstanding Balance
$8,859
Interest Rate
0.4%
Estimated Equity
$173,497
Purchase Details
Closed on
Jul 31, 2008
Sold by
Albright Jason D
Bought by
Bostdorf Dewey R
Home Financials for this Owner
Home Financials are based on the most recent Mortgage that was taken out on this home.
Original Mortgage
$68,458
Interest Rate
6.4%
Mortgage Type
FHA
Purchase Details
Closed on
Aug 31, 2001
Sold by
Knapp Timothy J
Bought by
Albright Judson D
Home Financials for this Owner
Home Financials are based on the most recent Mortgage that was taken out on this home.
Original Mortgage
$65,280
Interest Rate
7.05%
Create a Home Valuation Report for This Property
The Home Valuation Report is an in-depth analysis detailing your home's value as well as a comparison with similar homes in the area
Home Values in the Area
Average Home Value in this Area
Purchase History
| Date | Buyer | Sale Price | Title Company |
|---|---|---|---|
| Michaels Alexa E | $180,000 | None Listed On Document | |
| Bostdorf Dewey R | $69,000 | -- | |
| Albright Judson D | $64,000 | -- |
Source: Public Records
Mortgage History
| Date | Status | Borrower | Loan Amount |
|---|---|---|---|
| Open | Michaels Alexa E | $9,000 | |
| Open | Michaels Alexa E | $176,739 | |
| Previous Owner | Bostdorf Dewey R | $68,458 | |
| Previous Owner | Albright Judson D | $65,280 |
Source: Public Records
Tax History Compared to Growth
Tax History
| Year | Tax Paid | Tax Assessment Tax Assessment Total Assessment is a certain percentage of the fair market value that is determined by local assessors to be the total taxable value of land and additions on the property. | Land | Improvement |
|---|---|---|---|---|
| 2025 | $1,887 | $91,400 | $34,800 | $56,600 |
| 2024 | $1,780 | $91,400 | $34,800 | $56,600 |
| 2023 | $1,679 | $91,400 | $34,800 | $56,600 |
| 2022 | $1,579 | $91,400 | $34,800 | $56,600 |
| 2021 | $1,552 | $91,400 | $34,800 | $56,600 |
| 2020 | $1,515 | $91,400 | $34,800 | $56,600 |
| 2019 | $1,497 | $91,400 | $34,800 | $56,600 |
| 2018 | $1,480 | $91,400 | $34,800 | $56,600 |
| 2017 | $1,417 | $91,400 | $34,800 | $56,600 |
| 2016 | -- | $91,400 | $34,800 | $56,600 |
| 2015 | -- | $91,400 | $34,800 | $56,600 |
| 2014 | -- | $91,400 | $34,800 | $56,600 |
Source: Public Records
Map
Nearby Homes
- 52 Carlisle Ave
- 513 Dakemich Ct
- 117 Altoona Ave
- 231 W Columbia Rd
- 120 Wertzville Rd
- 305 W Shady Ln
- 34 S Enola Dr
- 163 Susquehanna Ave
- 11 W Highland Ave
- 115 S Enola Dr
- 239 N Enola Rd
- 120 S Enola Dr
- 11 High St
- 96 Queen Ave
- 104 Bungalow Rd
- 91 Queen Ave
- 42 Beaver Ave
- 57 Ashford Dr
- 28 Willow Way Dr
- 921 Maplewood Ln