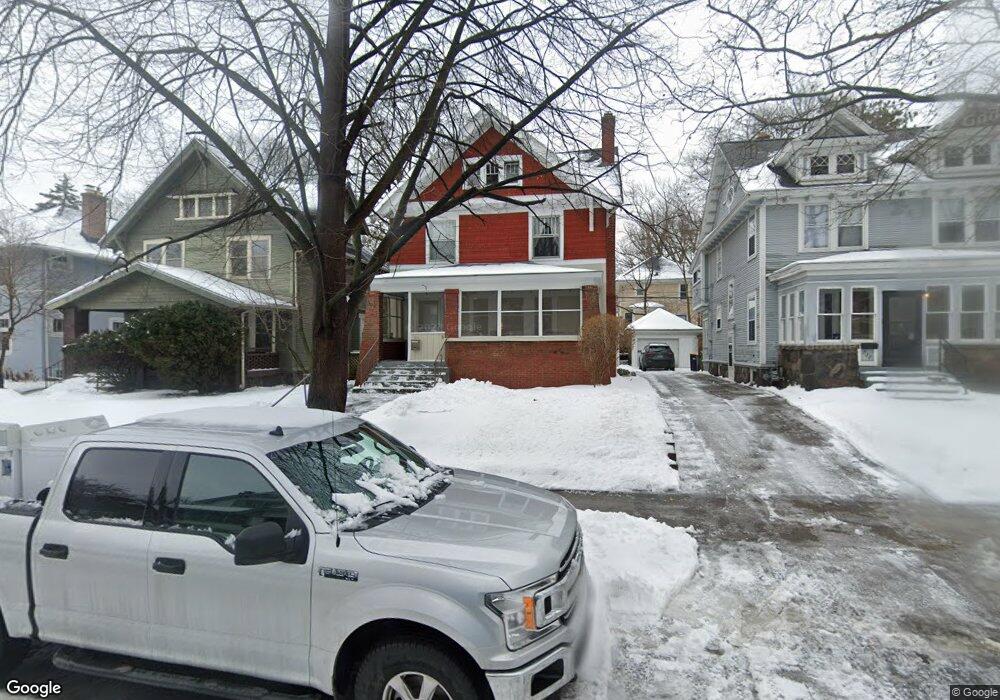
334 Hampton Ave SE Grand Rapids, MI 49506
Eastown NeighborhoodEstimated Value: $347,000 - $434,000
3
Beds
2
Baths
1,728
Sq Ft
$230/Sq Ft
Est. Value
About This Home
This home is located at 334 Hampton Ave SE, Grand Rapids, MI 49506 and is currently estimated at $396,962, approximately $229 per square foot. 334 Hampton Ave SE is a home located in Kent County with nearby schools including Congress Elementary, Alger Middle School, and Ottawa Hills High School.
Ownership History
Date
Name
Owned For
Owner Type
Purchase Details
Closed on
Apr 27, 2021
Sold by
Kohtz Kurt and Kronberg Bernadette
Bought by
Kohtz Kurt B and Kronberg Bernadette A
Current Estimated Value
Purchase Details
Closed on
Nov 13, 1998
Sold by
Leetsma Leetsma K K and Leetsma Kohtz K
Bought by
Kohtz and Kohtz Kronberg
Purchase Details
Closed on
Mar 21, 1991
Sold by
Lubbers Lubbers D D and Lubbers Leestma K
Bought by
Kohtz Kurt Kronberg Bernadette
Purchase Details
Closed on
Mar 20, 1991
Sold by
Campbell Campbell M M and Campbell Lubbers D
Bought by
Kohtz Kurt Kronberg Bernadette
Purchase Details
Closed on
Mar 17, 1991
Bought by
Kohtz Kurt Kronberg Bernadette
Purchase Details
Closed on
Jan 22, 1991
Sold by
Campbell Campbell M M and Campbell Lubbers D
Bought by
Kohtz Kurt Kronberg Bernadette
Purchase Details
Closed on
Aug 6, 1990
Sold by
Mooney Mooney M M and Mooney Campbell M
Bought by
Kohtz Kurt Kronberg Bernadette
Purchase Details
Closed on
Jan 5, 1990
Sold by
Mooney Mooney P P and Mooney M
Bought by
Kohtz Kurt Kronberg Bernadette
Create a Home Valuation Report for This Property
The Home Valuation Report is an in-depth analysis detailing your home's value as well as a comparison with similar homes in the area
Home Values in the Area
Average Home Value in this Area
Purchase History
| Date | Buyer | Sale Price | Title Company |
|---|---|---|---|
| Kohtz Kurt B | -- | None Available | |
| Kohtz | $100,000 | -- | |
| Kohtz Kurt Kronberg Bernadette | $57,000 | -- | |
| Kohtz Kurt Kronberg Bernadette | $45,000 | -- | |
| Kohtz Kurt Kronberg Bernadette | -- | -- | |
| Kohtz Kurt Kronberg Bernadette | -- | -- | |
| Kohtz Kurt Kronberg Bernadette | -- | -- | |
| Kohtz Kurt Kronberg Bernadette | -- | -- |
Source: Public Records
Tax History Compared to Growth
Tax History
| Year | Tax Paid | Tax Assessment Tax Assessment Total Assessment is a certain percentage of the fair market value that is determined by local assessors to be the total taxable value of land and additions on the property. | Land | Improvement |
|---|---|---|---|---|
| 2025 | $2,538 | $200,400 | $0 | $0 |
| 2024 | $2,538 | $175,100 | $0 | $0 |
| 2023 | $2,575 | $161,100 | $0 | $0 |
| 2022 | $2,445 | $139,000 | $0 | $0 |
| 2021 | $2,390 | $126,700 | $0 | $0 |
| 2020 | $2,285 | $112,300 | $0 | $0 |
| 2019 | $2,328 | $107,000 | $0 | $0 |
| 2018 | $2,248 | $100,600 | $0 | $0 |
| 2017 | $2,188 | $91,400 | $0 | $0 |
| 2016 | $2,215 | $84,600 | $0 | $0 |
| 2015 | $2,060 | $84,600 | $0 | $0 |
| 2013 | -- | $78,000 | $0 | $0 |
Source: Public Records
Map
Nearby Homes
- 437 Rosewood Ave SE
- 1244 Lake Dr SE
- 1237 Wealthy St SE
- 2350 Elinor Ln SE Unit Lot 7
- 2359 Elinor Ln SE
- 638 Gladstone Dr SE
- 1950 Robinson Rd SE
- 12 Wallinwood Ave NE
- 656 Gladstone Dr SE
- 240 Calkins Ave SE
- 45 Baynton Ave NE
- 715 Gladstone Dr SE
- 1200 Sherman St SE
- 720 Giddings Ave SE
- 1101 Bemis St SE
- 1033 Sigsbee St SE
- 3 Woodward Ln SE
- 318 Diamond Ave SE
- 145 Baynton Ave NE
- 1118 Fulton St E
- 330 Hampton Ave SE
- 338 Hampton Ave SE
- 326 Hampton Ave SE
- 342 Hampton Ave SE
- 333 Norwood Ave SE
- 339 Norwood Ave SE
- 329 Norwood Ave SE
- 343 Norwood Ave SE
- 320 Hampton Ave SE
- 346 Hampton Ave SE
- 325 Norwood Ave SE
- 347 Norwood Ave SE
- 333 Hampton Ave SE
- 329 Hampton Ave SE
- 321 Norwood Ave SE
- 337 Hampton Ave SE
- 316 Hampton Ave SE
- 352 Hampton Ave SE
- 341 Hampton Ave SE
- 351 Norwood Ave SE