
Seller's Agent in 2024
Valerie Conrad
Windermere Corporate
(509) 679-1941
19 in this area
76 Total Sales
Estimated Value: $1,519,000 - $1,760,000
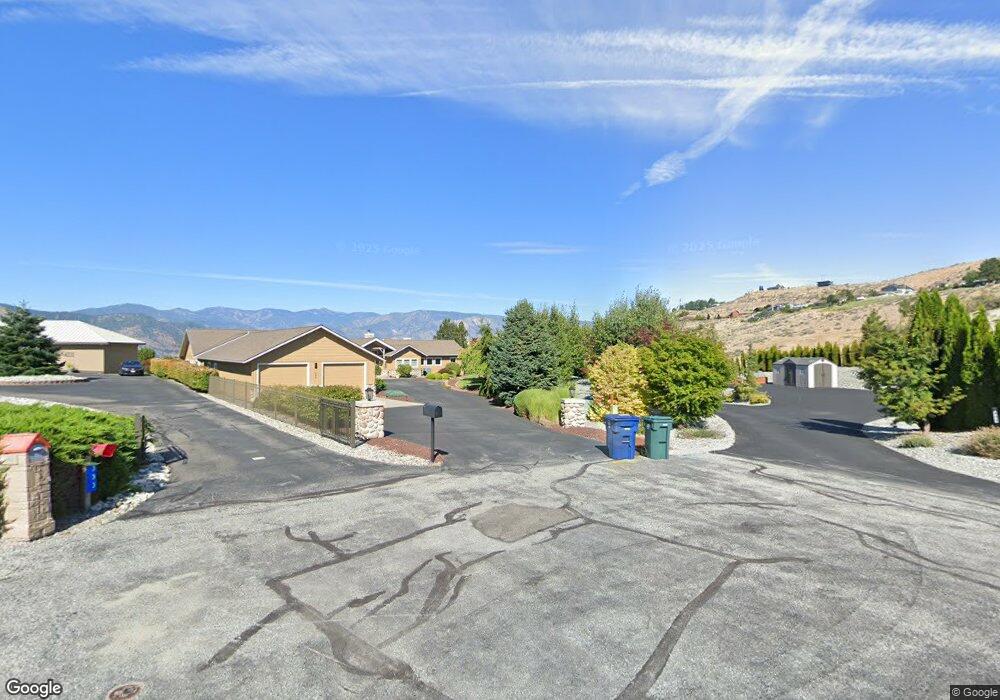
Stunning contemporary view home in the popular subdivision of Lake Chelan Highlands.This immaculate home has three bedrooms, a bonus room, media room, main level primary bedroom, clear lite deck and covered patio. An estate lot with 1.8 acres of unobstructed lake and mountain views. Even the deck is clear glass light panels.There is room for a private pool to be added. Lots of parking for large vehicles in the upper portion of the lot and an attached 2 car heated garage. A low maintenance profile that makes this an easy transition for relocation or downsizing. Abundant storage throughout. This property is part of Lake Chelan Hills COMMUNITY WATERFRONT with all amenities of pool, lake access thru private day parks, two pools and boat launch.
| Date | Buyer | Sale Price | Title Company |
|---|---|---|---|
| Hooper Jack | $143,000 | First American Title |
| Date | Event | Price | List to Sale | Price per Sq Ft | Prior Sale |
|---|---|---|---|---|---|
| 09/27/2024 09/27/24 | Sold | $1,535,000 | -1.5% | $495 / Sq Ft | View Prior Sale |
| 08/28/2024 08/28/24 | Pending | -- | -- | -- | |
| 08/02/2024 08/02/24 | Price Changed | $1,559,000 | -3.8% | $502 / Sq Ft | |
| 06/01/2024 06/01/24 | Price Changed | $1,619,950 | -4.4% | $522 / Sq Ft | |
| 03/31/2024 03/31/24 | For Sale | $1,695,000 | -- | $546 / Sq Ft |
| Year | Tax Paid | Tax Assessment Tax Assessment Total Assessment is a certain percentage of the fair market value that is determined by local assessors to be the total taxable value of land and additions on the property. | Land | Improvement |
|---|---|---|---|---|
| 2021 | $7,293 | $841,023 | $231,038 | $609,985 |
| 2020 | $5,383 | $711,520 | $220,986 | $490,534 |
| 2019 | $4,343 | $578,081 | $197,814 | $380,267 |
| 2018 | $4,794 | $478,252 | $189,902 | $288,350 |
| 2017 | $4,341 | $476,091 | $190,167 | $285,924 |
| 2016 | $1,566 | $460,445 | $157,192 | $303,253 |
| 2015 | $1,566 | $162,490 | $162,490 | $0 |
| 2013 | $1,566 | $141,296 | $141,296 | $0 |
Seller's Agent in 2024
Valerie Conrad
Windermere Corporate
(509) 679-1941
19 in this area
76 Total Sales
Buyer's Agent in 2024
Cole Harvey
Nick McLean Real Estate Group
(541) 720-8108
1 in this area
118 Total Sales