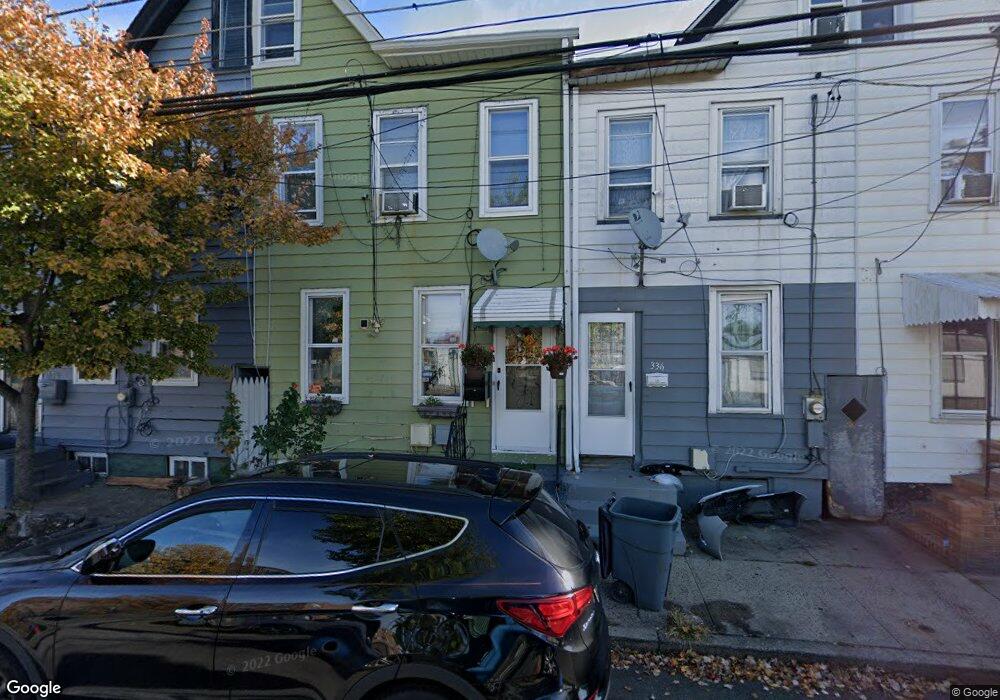
334 Jersey St Trenton, NJ 08611
South Trenton NeighborhoodEstimated Value: $113,000 - $212,000
--
Bed
--
Bath
1,336
Sq Ft
$127/Sq Ft
Est. Value
About This Home
This home is located at 334 Jersey St, Trenton, NJ 08611 and is currently estimated at $169,333, approximately $126 per square foot. 334 Jersey St is a home located in Mercer County with nearby schools including Mott Elementary School, Parker Elementary School, and Dr. Crosby Copeland Elementary School.
Ownership History
Date
Name
Owned For
Owner Type
Purchase Details
Closed on
Jul 13, 2022
Sold by
Tnt Investments Group Llc
Bought by
Sym Equities Llc
Current Estimated Value
Purchase Details
Closed on
Feb 18, 2009
Sold by
Tntp Inc
Bought by
Tnt Investments Group Llc
Purchase Details
Closed on
Jun 9, 2006
Sold by
Bahloza Sushama
Bought by
Nelson Thomas
Home Financials for this Owner
Home Financials are based on the most recent Mortgage that was taken out on this home.
Original Mortgage
$81,600
Interest Rate
6.62%
Purchase Details
Closed on
Jan 27, 2003
Sold by
Wyrwas Raymond
Bought by
Bahloza Sushama
Create a Home Valuation Report for This Property
The Home Valuation Report is an in-depth analysis detailing your home's value as well as a comparison with similar homes in the area
Home Values in the Area
Average Home Value in this Area
Purchase History
| Date | Buyer | Sale Price | Title Company |
|---|---|---|---|
| Sym Equities Llc | $80,000 | Wfg National Title | |
| Sym Equities Llc | $80,000 | Wfg National Title | |
| Tnt Investments Group Llc | -- | None Available | |
| Nelson Thomas | $102,000 | -- | |
| Bahloza Sushama | $47,000 | -- |
Source: Public Records
Mortgage History
| Date | Status | Borrower | Loan Amount |
|---|---|---|---|
| Previous Owner | Nelson Thomas | $81,600 |
Source: Public Records
Tax History Compared to Growth
Tax History
| Year | Tax Paid | Tax Assessment Tax Assessment Total Assessment is a certain percentage of the fair market value that is determined by local assessors to be the total taxable value of land and additions on the property. | Land | Improvement |
|---|---|---|---|---|
| 2025 | $2,268 | $39,100 | $8,500 | $30,600 |
| 2024 | $2,177 | $39,100 | $8,500 | $30,600 |
| 2023 | $2,177 | $39,100 | $8,500 | $30,600 |
| 2022 | $2,134 | $39,100 | $8,500 | $30,600 |
| 2021 | $2,171 | $39,100 | $8,500 | $30,600 |
| 2020 | $2,164 | $39,100 | $8,500 | $30,600 |
| 2019 | $2,129 | $39,100 | $8,500 | $30,600 |
| 2018 | $2,038 | $39,100 | $8,500 | $30,600 |
| 2017 | $1,937 | $39,100 | $8,500 | $30,600 |
| 2016 | $3,216 | $55,900 | $15,200 | $40,700 |
| 2015 | $3,205 | $55,900 | $15,200 | $40,700 |
| 2014 | $3,190 | $55,900 | $15,200 | $40,700 |
Source: Public Records
Map
Nearby Homes