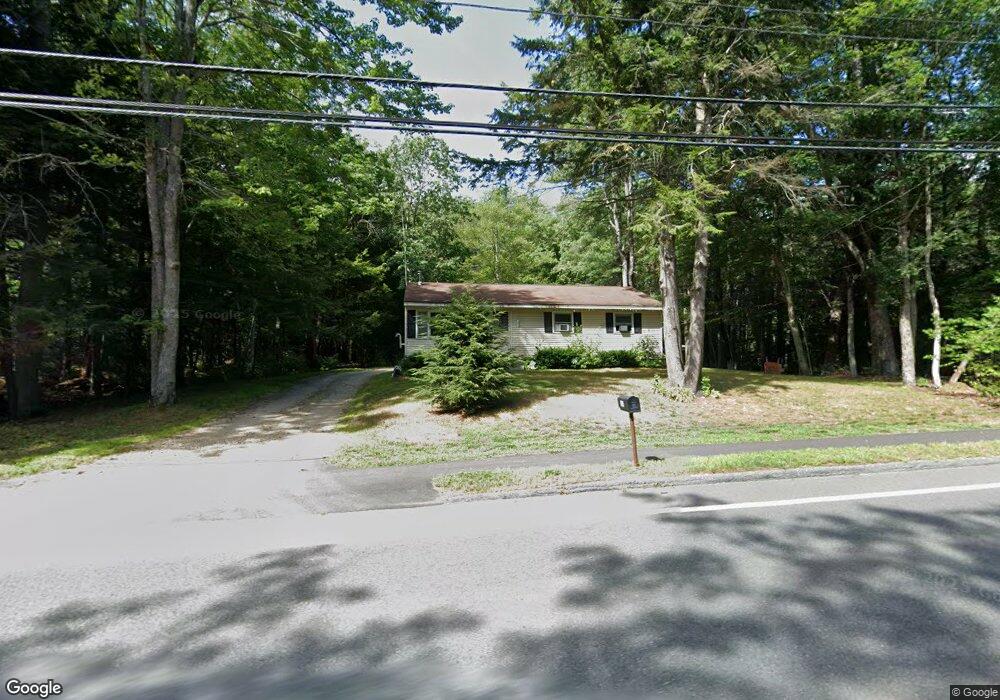
334 Maple St Winchendon, MA 01475
Estimated Value: $213,000 - $294,000
2
Beds
1
Bath
1,538
Sq Ft
$177/Sq Ft
Est. Value
About This Home
This home is located at 334 Maple St, Winchendon, MA 01475 and is currently estimated at $271,713, approximately $176 per square foot. 334 Maple St is a home located in Worcester County with nearby schools including Memorial, Toy Town Elementary School, and The Winchendon School.
Ownership History
Date
Name
Owned For
Owner Type
Purchase Details
Closed on
Aug 3, 1973
Bought by
Eddy Donald R and Eddy Gloria J
Current Estimated Value
Create a Home Valuation Report for This Property
The Home Valuation Report is an in-depth analysis detailing your home's value as well as a comparison with similar homes in the area
Home Values in the Area
Average Home Value in this Area
Purchase History
| Date | Buyer | Sale Price | Title Company |
|---|---|---|---|
| Eddy Donald R | -- | -- |
Source: Public Records
Mortgage History
| Date | Status | Borrower | Loan Amount |
|---|---|---|---|
| Closed | Eddy Donald R | $63,000 | |
| Closed | Eddy Donald R | $50,001 |
Source: Public Records
Tax History Compared to Growth
Tax History
| Year | Tax Paid | Tax Assessment Tax Assessment Total Assessment is a certain percentage of the fair market value that is determined by local assessors to be the total taxable value of land and additions on the property. | Land | Improvement |
|---|---|---|---|---|
| 2025 | $2,846 | $242,200 | $37,000 | $205,200 |
| 2024 | $2,707 | $215,900 | $35,400 | $180,500 |
| 2023 | $2,653 | $198,000 | $34,600 | $163,400 |
| 2022 | $3,007 | $199,000 | $43,600 | $155,400 |
| 2021 | $2,823 | $179,600 | $39,700 | $139,900 |
| 2020 | $2,742 | $168,400 | $37,000 | $131,400 |
| 2019 | $2,649 | $158,500 | $34,200 | $124,300 |
| 2018 | $2,436 | $140,400 | $31,900 | $108,500 |
| 2017 | $2,446 | $136,100 | $34,600 | $101,500 |
| 2016 | $2,344 | $134,500 | $33,000 | $101,500 |
| 2015 | $2,249 | $134,500 | $33,000 | $101,500 |
| 2014 | $2,108 | $132,100 | $34,900 | $97,200 |
Source: Public Records
Map
Nearby Homes