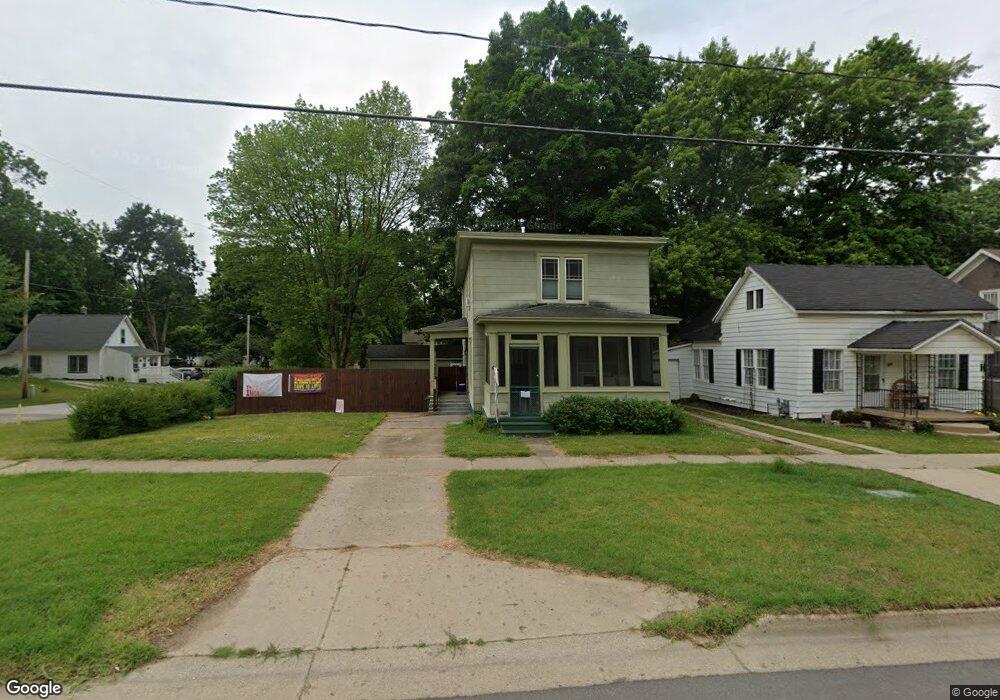
334 Marshall St Allegan, MI 49010
Estimated Value: $157,000 - $240,000
3
Beds
2
Baths
1,600
Sq Ft
$120/Sq Ft
Est. Value
About This Home
This home is located at 334 Marshall St, Allegan, MI 49010 and is currently estimated at $192,549, approximately $120 per square foot. 334 Marshall St is a home located in Allegan County with nearby schools including Pine Trails Elementary School, L.E. White Middle School, and Allegan High School.
Ownership History
Date
Name
Owned For
Owner Type
Purchase Details
Closed on
Sep 19, 2025
Sold by
Ramaker Jason L and Ramaker Sara M
Bought by
Ramaker Sara M and Ramaker Family Trust
Current Estimated Value
Purchase Details
Closed on
Jun 18, 2010
Sold by
Price Fred and Price Patti
Bought by
Ramaker Jason L and Ramaker Sara M
Home Financials for this Owner
Home Financials are based on the most recent Mortgage that was taken out on this home.
Original Mortgage
$67,096
Interest Rate
5.25%
Mortgage Type
FHA
Purchase Details
Closed on
Jun 18, 1990
Sold by
Price Robert I and Price Betty A
Bought by
Price Fred and Belden Gwendolyn
Create a Home Valuation Report for This Property
The Home Valuation Report is an in-depth analysis detailing your home's value as well as a comparison with similar homes in the area
Home Values in the Area
Average Home Value in this Area
Purchase History
| Date | Buyer | Sale Price | Title Company |
|---|---|---|---|
| Ramaker Sara M | -- | None Listed On Document | |
| Ramaker Jason L | $68,000 | Chicago Title | |
| Price Fred | -- | -- |
Source: Public Records
Mortgage History
| Date | Status | Borrower | Loan Amount |
|---|---|---|---|
| Previous Owner | Ramaker Jason L | $67,096 |
Source: Public Records
Tax History Compared to Growth
Tax History
| Year | Tax Paid | Tax Assessment Tax Assessment Total Assessment is a certain percentage of the fair market value that is determined by local assessors to be the total taxable value of land and additions on the property. | Land | Improvement |
|---|---|---|---|---|
| 2025 | $1,452 | $62,200 | $13,000 | $49,200 |
| 2024 | $1,322 | $54,200 | $11,300 | $42,900 |
| 2023 | $1,369 | $45,300 | $10,800 | $34,500 |
| 2022 | $1,322 | $39,400 | $8,900 | $30,500 |
| 2021 | $1,264 | $37,200 | $7,100 | $30,100 |
| 2020 | $1,245 | $41,900 | $6,500 | $35,400 |
| 2019 | $1,215 | $39,100 | $6,100 | $33,000 |
| 2018 | $1,167 | $33,300 | $6,000 | $27,300 |
| 2017 | $0 | $31,200 | $5,000 | $26,200 |
| 2016 | $0 | $26,000 | $4,200 | $21,800 |
| 2015 | -- | $26,000 | $4,200 | $21,800 |
| 2014 | -- | $27,100 | $4,200 | $22,900 |
| 2013 | $1,288 | $28,900 | $4,200 | $24,700 |
Source: Public Records
Map
Nearby Homes