Estimated Value: $574,000 - $651,000
5
Beds
4
Baths
3,286
Sq Ft
$186/Sq Ft
Est. Value
About This Home
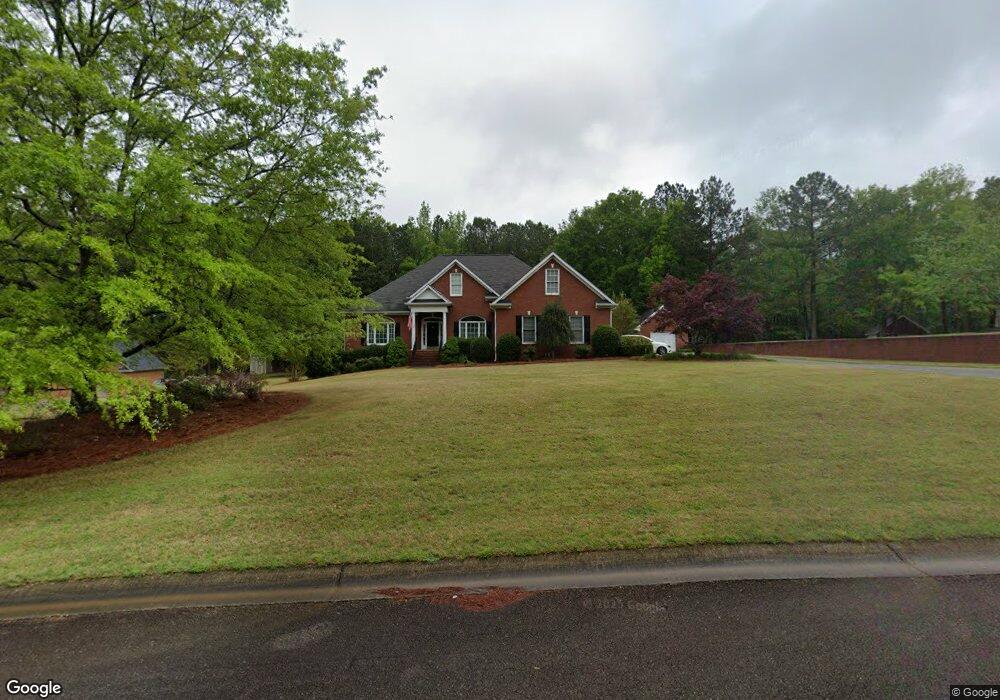
This home is located at 334 Millbrook Cir Unit 11, Hull, GA 30646 and is currently estimated at $612,756, approximately $186 per square foot. 334 Millbrook Cir Unit 11 is a home located in Madison County with nearby schools including Madison County High School.
Ownership History
Date
Name
Owned For
Owner Type
Purchase Details
Closed on
Nov 29, 2021
Sold by
Mcginnis Nicola Ashley
Bought by
Pfender Kathryn L and Pfender Michael E
Current Estimated Value
Home Financials for this Owner
Home Financials are based on the most recent Mortgage that was taken out on this home.
Original Mortgage
$366,400
Outstanding Balance
$335,566
Interest Rate
3.14%
Mortgage Type
New Conventional
Estimated Equity
$277,190
Purchase Details
Closed on
Jan 16, 2020
Sold by
Minish Pat B
Bought by
Mcginnis James Paul and Mcginnis Nicola Ashley
Home Financials for this Owner
Home Financials are based on the most recent Mortgage that was taken out on this home.
Original Mortgage
$377,150
Interest Rate
3.7%
Mortgage Type
New Conventional
Purchase Details
Closed on
Feb 1, 2001
Sold by
Pickerel Troy M and Pickerel We
Bought by
Minish Pat B
Purchase Details
Closed on
Oct 27, 1999
Sold by
Hipp Residential Con
Bought by
Pickerel Troy M and Pickerel We
Purchase Details
Closed on
Jan 1, 1995
Bought by
Hipp Residential Con
Create a Home Valuation Report for This Property
The Home Valuation Report is an in-depth analysis detailing your home's value as well as a comparison with similar homes in the area
Home Values in the Area
Average Home Value in this Area
Purchase History
| Date | Buyer | Sale Price | Title Company |
|---|---|---|---|
| Pfender Kathryn L | $463,000 | -- | |
| Mcginnis James Paul | $397,000 | -- | |
| Minish Pat B | $26,000 | -- | |
| Pickerel Troy M | $25,000 | -- | |
| Hipp Residential Con | -- | -- |
Source: Public Records
Mortgage History
| Date | Status | Borrower | Loan Amount |
|---|---|---|---|
| Open | Pfender Kathryn L | $366,400 | |
| Previous Owner | Mcginnis James Paul | $377,150 |
Source: Public Records
Tax History Compared to Growth
Tax History
| Year | Tax Paid | Tax Assessment Tax Assessment Total Assessment is a certain percentage of the fair market value that is determined by local assessors to be the total taxable value of land and additions on the property. | Land | Improvement |
|---|---|---|---|---|
| 2024 | $5,845 | $226,556 | $20,000 | $206,556 |
| 2023 | $6,518 | $213,518 | $20,000 | $193,518 |
| 2022 | $5,053 | $191,586 | $20,000 | $171,586 |
| 2021 | $4,841 | $158,573 | $20,000 | $138,573 |
| 2020 | $4,567 | $158,573 | $20,000 | $138,573 |
| 2019 | $3,985 | $138,154 | $20,000 | $118,154 |
| 2018 | $3,926 | $135,875 | $20,000 | $115,875 |
| 2017 | $3,908 | $135,737 | $20,000 | $115,737 |
| 2016 | $3,171 | $120,486 | $20,000 | $100,486 |
| 2015 | $3,168 | $120,486 | $20,000 | $100,486 |
| 2014 | $3,173 | $111,816 | $20,000 | $91,816 |
| 2013 | -- | $111,816 | $20,000 | $91,816 |
Source: Public Records
Map
Nearby Homes
- 0 Spratlin Mill Rd Unit 1025918
- 0 Spratlin Mill Rd Unit 10526335
- 0 Spratlin Mill Dr Unit 7665837
- 0 Spratlin Mill Dr Unit LOT 14-C
- 151 Rolling Woods Ln
- 385 McCannon Morris Rd
- 0 Virginia Ln Unit Lot 15 CL336098
- 0 Virginia Ln Unit LOT 15 10579204
- 660 McCannon Morris Rd
- 1329 Spratlin Mill Dr
- 119 Jack Sharp Rd
- 838 Virginia Ln
- 489 Childers Rd
- 703 Jack Sharp Rd
- 210 Joe Graham Rd
- 0 Woodland Creek Place Unit 10421130
- 181 Bedford Dr
- 685 Bedford Dr
- 525 Virginia Ln
- 1750 Charlie Bolton Rd
- 334 Millbrook Cir
- 314 Millbrook Cir
- 314 Millbrook Cir Unit 10
- 354 Millbrook Cir
- 290 Millbrook Cir
- 277 Millbrook Cir
- 353 Millbrook Cir
- 410 Millbrook Cir
- 270 Millbrook Cir
- 413 Millbrook Cir
- 203 Millbrook Cir
- 0 Millbrook Cir Unit Lot 4 CM986776
- 0 Millbrook Cir Unit 20130665
- 0 Millbrook Cir Unit LOT 4 10022330
- 0 Millbrook Cir Unit Lot 4 986776
- 0 Millbrook Cir Unit Lot 4
- 236 Millbrook Cir
- 3251 Spratlin Mill Rd
- 129 Millbrook Cir
- 35 Millbrook Ln