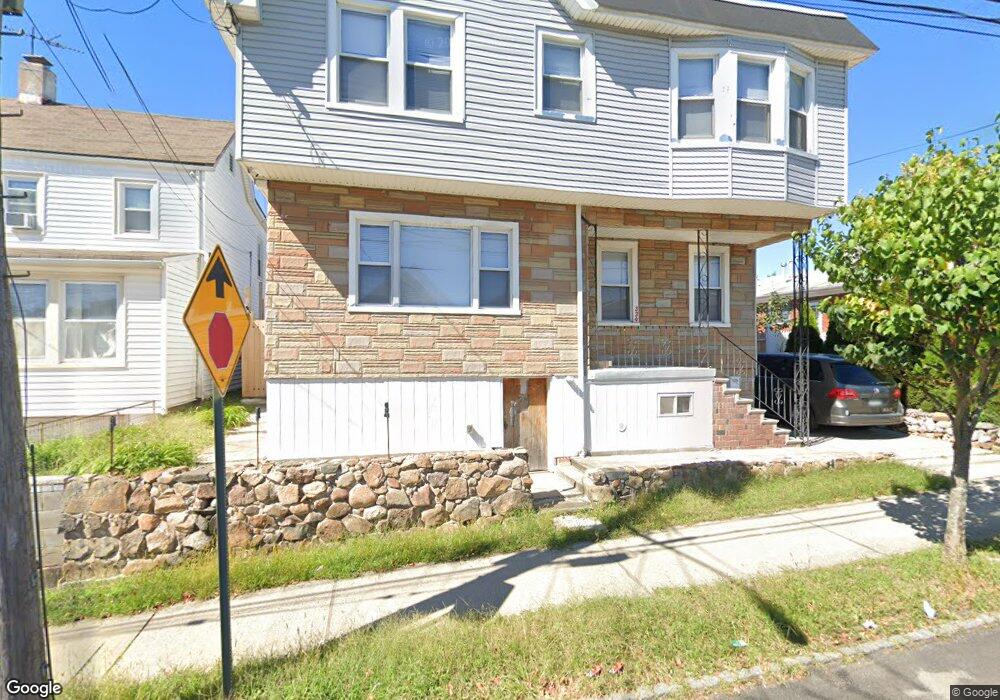
334 Mosel Ave Unit 1F Staten Island, NY 10304
Concord NeighborhoodEstimated Value: $625,000 - $731,000
1
Bed
1
Bath
1,720
Sq Ft
$402/Sq Ft
Est. Value
About This Home
This home is located at 334 Mosel Ave Unit 1F, Staten Island, NY 10304 and is currently estimated at $691,668, approximately $402 per square foot. 334 Mosel Ave Unit 1F is a home located in Richmond County with nearby schools including P.S. 57 - Hubert H. Humphrey, I.S. 49 Berta A Dreyfus, and New Dorp High School.
Ownership History
Date
Name
Owned For
Owner Type
Purchase Details
Closed on
Sep 29, 2017
Sold by
334 Mosel Corp
Bought by
Huang May Mei Yi
Current Estimated Value
Home Financials for this Owner
Home Financials are based on the most recent Mortgage that was taken out on this home.
Original Mortgage
$360,000
Outstanding Balance
$300,378
Interest Rate
3.78%
Mortgage Type
New Conventional
Estimated Equity
$391,290
Purchase Details
Closed on
Nov 18, 2016
Sold by
The Estate Of Michael T Smyth and Smyth Patrick
Bought by
334 Mosel Corp
Create a Home Valuation Report for This Property
The Home Valuation Report is an in-depth analysis detailing your home's value as well as a comparison with similar homes in the area
Home Values in the Area
Average Home Value in this Area
Purchase History
| Date | Buyer | Sale Price | Title Company |
|---|---|---|---|
| Huang May Mei Yi | $450,000 | Your Title Experts | |
| 334 Mosel Corp | $255,000 | The Security Title Guarantee |
Source: Public Records
Mortgage History
| Date | Status | Borrower | Loan Amount |
|---|---|---|---|
| Open | Huang May Mei Yi | $360,000 |
Source: Public Records
Tax History Compared to Growth
Tax History
| Year | Tax Paid | Tax Assessment Tax Assessment Total Assessment is a certain percentage of the fair market value that is determined by local assessors to be the total taxable value of land and additions on the property. | Land | Improvement |
|---|---|---|---|---|
| 2025 | $7,494 | $45,720 | $9,756 | $35,964 |
| 2024 | $7,494 | $44,220 | $9,670 | $34,550 |
| 2023 | $7,578 | $37,313 | $9,244 | $28,069 |
| 2022 | $7,407 | $40,080 | $11,460 | $28,620 |
| 2021 | $6,393 | $34,860 | $11,460 | $23,400 |
| 2020 | $5,024 | $29,640 | $11,460 | $18,180 |
| 2019 | $4,685 | $28,620 | $11,460 | $17,160 |
| 2018 | $4,565 | $22,394 | $8,010 | $14,384 |
| 2017 | $4,230 | $22,222 | $8,935 | $13,287 |
| 2016 | $3,881 | $20,966 | $10,882 | $10,084 |
| 2015 | $3,276 | $19,780 | $9,116 | $10,664 |
| 2014 | $3,276 | $18,662 | $8,312 | $10,350 |
Source: Public Records
Map
Nearby Homes