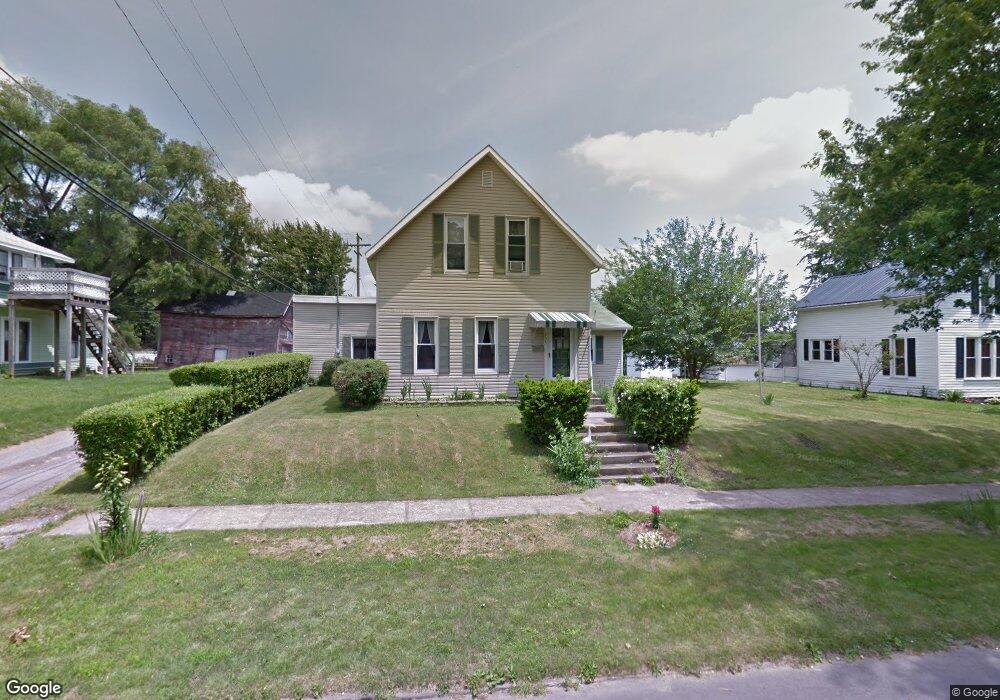
334 N Cherry St Kenton, OH 43326
Estimated Value: $184,000 - $205,000
4
Beds
1
Bath
2,323
Sq Ft
$83/Sq Ft
Est. Value
About This Home
This home is located at 334 N Cherry St, Kenton, OH 43326 and is currently estimated at $192,396, approximately $82 per square foot. 334 N Cherry St is a home located in Hardin County with nearby schools including Kenton Elementary School, Kenton Middle School, and Kenton High School.
Ownership History
Date
Name
Owned For
Owner Type
Purchase Details
Closed on
Sep 5, 2017
Sold by
Preston Matthew S
Bought by
Wells Dennis
Current Estimated Value
Home Financials for this Owner
Home Financials are based on the most recent Mortgage that was taken out on this home.
Original Mortgage
$48,500
Outstanding Balance
$40,566
Interest Rate
3.96%
Mortgage Type
New Conventional
Estimated Equity
$151,830
Purchase Details
Closed on
Apr 2, 2008
Sold by
Preston Keisha A
Bought by
Preston Matthew S
Purchase Details
Closed on
Nov 25, 2003
Bought by
Preston Matthew S and Preston Keis
Purchase Details
Closed on
Jun 25, 2003
Bought by
Hardin Comm Fed Credit U
Purchase Details
Closed on
Jun 8, 1999
Bought by
Seiler Tracey H
Purchase Details
Closed on
Aug 29, 1994
Bought by
Seiler Tracey H and Seiler Brandy
Purchase Details
Closed on
Aug 26, 1987
Create a Home Valuation Report for This Property
The Home Valuation Report is an in-depth analysis detailing your home's value as well as a comparison with similar homes in the area
Home Values in the Area
Average Home Value in this Area
Purchase History
| Date | Buyer | Sale Price | Title Company |
|---|---|---|---|
| Wells Dennis | $50,000 | None Available | |
| Preston Matthew S | -- | None Available | |
| Preston Matthew S | $55,000 | -- | |
| Hardin Comm Fed Credit U | $47,000 | -- | |
| Seiler Tracey H | -- | -- | |
| Seiler Tracey H | $35,000 | -- | |
| -- | -- | -- |
Source: Public Records
Mortgage History
| Date | Status | Borrower | Loan Amount |
|---|---|---|---|
| Open | Wells Dennis | $48,500 |
Source: Public Records
Tax History
| Year | Tax Paid | Tax Assessment Tax Assessment Total Assessment is a certain percentage of the fair market value that is determined by local assessors to be the total taxable value of land and additions on the property. | Land | Improvement |
|---|---|---|---|---|
| 2024 | $1,953 | $45,310 | $3,520 | $41,790 |
| 2023 | $1,966 | $45,310 | $3,520 | $41,790 |
| 2022 | $1,812 | $39,090 | $2,640 | $36,450 |
| 2021 | $1,791 | $38,510 | $2,640 | $35,870 |
| 2020 | $1,622 | $38,510 | $2,640 | $35,870 |
| 2019 | $1,251 | $32,000 | $2,520 | $29,480 |
| 2018 | $1,132 | $28,880 | $2,520 | $26,360 |
| 2017 | $1,114 | $28,880 | $2,520 | $26,360 |
| 2016 | $929 | $25,150 | $3,570 | $21,580 |
| 2015 | $907 | $25,150 | $3,570 | $21,580 |
| 2014 | $926 | $25,150 | $3,570 | $21,580 |
| 2013 | $1,010 | $26,430 | $3,570 | $22,860 |
Source: Public Records
Map
Nearby Homes
- 405 E Carrol St Unit 405 1/2
- 405 E Carroll St
- 233 N Main St
- 509 E North St
- 0 N Barron St Unit Lot 6
- 0 N Barron St Unit Lot 8
- 0 N Barron St Unit Lot 3
- 0 N Barron St Unit Lot 2
- 0 N Barron St Unit Lot 4
- 310 N Market St
- 219 W Carrol St
- 619 E North St
- 503 Jennings St Unit Lot 7
- 121 S High St
- 416 E Eliza St Unit Lot 1
- 411 E Eliza St
- 39 Grape St
- 530 E Franklin St
- 226 S Wayne St
- 79 Broadway St
Your Personal Tour Guide
Ask me questions while you tour the home.