334 NW Springview Loop Port Saint Lucie, FL 34986
Saint Lucie West NeighborhoodEstimated Value: $350,547 - $399,000
3
Beds
2
Baths
1,742
Sq Ft
$214/Sq Ft
Est. Value
About This Home
This home is located at 334 NW Springview Loop, Port Saint Lucie, FL 34986 and is currently estimated at $373,387, approximately $214 per square foot. 334 NW Springview Loop is a home located in St. Lucie County with nearby schools including West Gate K-8 School, Bayshore Elementary School, and Oak Hammock K-8 School.
Ownership History
Date
Name
Owned For
Owner Type
Purchase Details
Closed on
Jan 16, 2024
Sold by
Irwin Karon
Bought by
Irwin Karon Living Trust and Karon
Current Estimated Value
Purchase Details
Closed on
Dec 27, 2005
Sold by
Kim Jay Sun and Vu Elizabeth
Bought by
Karon Irwin and Karon Beverly
Home Financials for this Owner
Home Financials are based on the most recent Mortgage that was taken out on this home.
Original Mortgage
$100,000
Interest Rate
6.19%
Mortgage Type
Fannie Mae Freddie Mac
Purchase Details
Closed on
Jan 28, 2005
Sold by
Levitt Homes Llc
Bought by
Kim Jay Sun and Vu Elizabeth
Home Financials for this Owner
Home Financials are based on the most recent Mortgage that was taken out on this home.
Original Mortgage
$170,492
Interest Rate
4.75%
Mortgage Type
New Conventional
Create a Home Valuation Report for This Property
The Home Valuation Report is an in-depth analysis detailing your home's value as well as a comparison with similar homes in the area
Home Values in the Area
Average Home Value in this Area
Purchase History
| Date | Buyer | Sale Price | Title Company |
|---|---|---|---|
| Irwin Karon Living Trust | $100 | None Listed On Document | |
| Irwin Karon Living Trust | $100 | None Listed On Document | |
| Karon Irwin | $298,000 | Chelsea Title Company | |
| Kim Jay Sun | $213,200 | U F C Title Ins Agency Llc |
Source: Public Records
Mortgage History
| Date | Status | Borrower | Loan Amount |
|---|---|---|---|
| Previous Owner | Karon Irwin | $100,000 | |
| Previous Owner | Kim Jay Sun | $170,492 |
Source: Public Records
Tax History Compared to Growth
Tax History
| Year | Tax Paid | Tax Assessment Tax Assessment Total Assessment is a certain percentage of the fair market value that is determined by local assessors to be the total taxable value of land and additions on the property. | Land | Improvement |
|---|---|---|---|---|
| 2025 | $4,042 | $307,800 | $85,000 | $222,800 |
| 2024 | $3,927 | $178,383 | -- | -- |
| 2023 | $3,927 | $173,188 | $0 | $0 |
| 2022 | $3,762 | $168,144 | $0 | $0 |
| 2021 | $3,646 | $163,247 | $0 | $0 |
| 2020 | $3,664 | $160,994 | $0 | $0 |
| 2019 | $3,630 | $157,375 | $0 | $0 |
| 2018 | $3,466 | $154,441 | $0 | $0 |
| 2017 | $3,561 | $197,500 | $55,000 | $142,500 |
| 2016 | $3,562 | $183,300 | $55,000 | $128,300 |
| 2015 | $3,594 | $165,800 | $50,000 | $115,800 |
| 2014 | $3,433 | $145,957 | $0 | $0 |
Source: Public Records
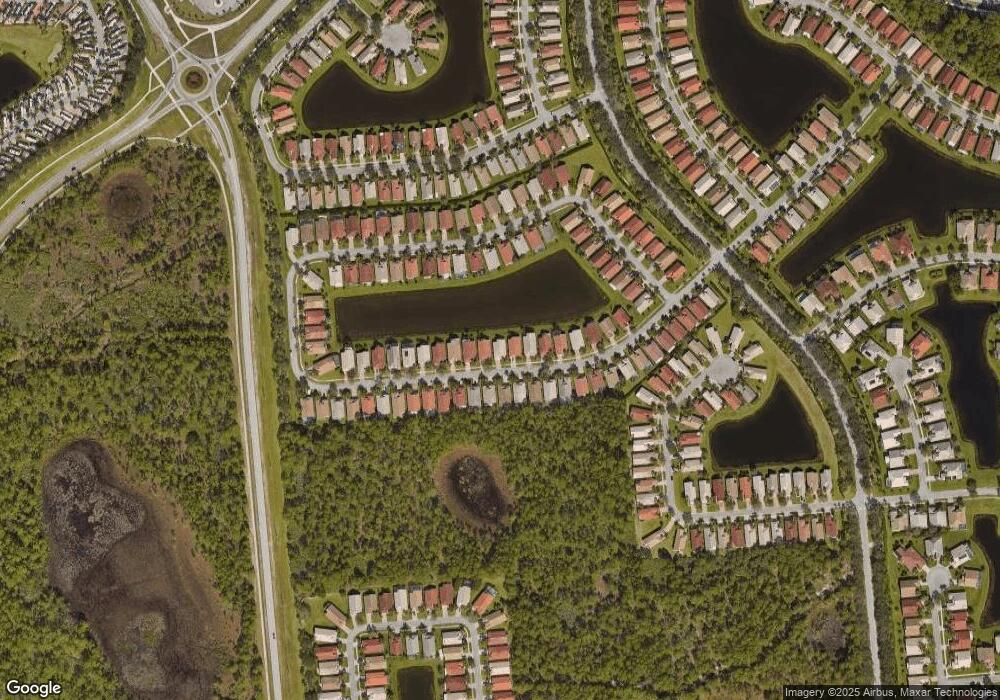
Map
Nearby Homes
- 389 NW Springview Loop
- 324 NW Treeline Trace
- 324 NW Breezy Point Loop
- 338 NW Treeline Trace
- 284 NW Toscane Trail
- 340 NW Breezy Point Loop
- 319 NW Treeline Trace
- 344 NW Breezy Point Loop
- 303 NW Treeline Trace
- 307 NW Clearview Ct
- 302 NW Toscane Trail
- 301 NW Clearview Ct
- 255 NW Toscane Trail
- 318 NW Toscane Trail
- 417 NW Sunview Way
- 159 NW Hazard Way
- 170 NW Hazard Way
- 171 NW Hazard Way
- 446 NW Brookville Ct
- 241 NW Toscane Trail
- 332 NW Springview Loop
- 336 NW Springview Loop
- 330 NW Springview Loop
- 338 NW Springview Loop
- 333 NW Springview Loop
- 328 NW Springview Loop
- 340 NW Springview Loop
- 331 NW Springview Loop
- 335 NW Springview Loop
- 329 NW Springview Loop
- 337 NW Springview Loop
- 326 NW Springview Loop
- 342 NW Springview Loop
- 327 NW Springview Loop
- 339 NW Springview Loop
- 325 NW Springview Loop
- 341 NW Springview Loop
- 344 NW Springview Loop
- 322 NW Springview Loop
- 343 NW Springview Loop