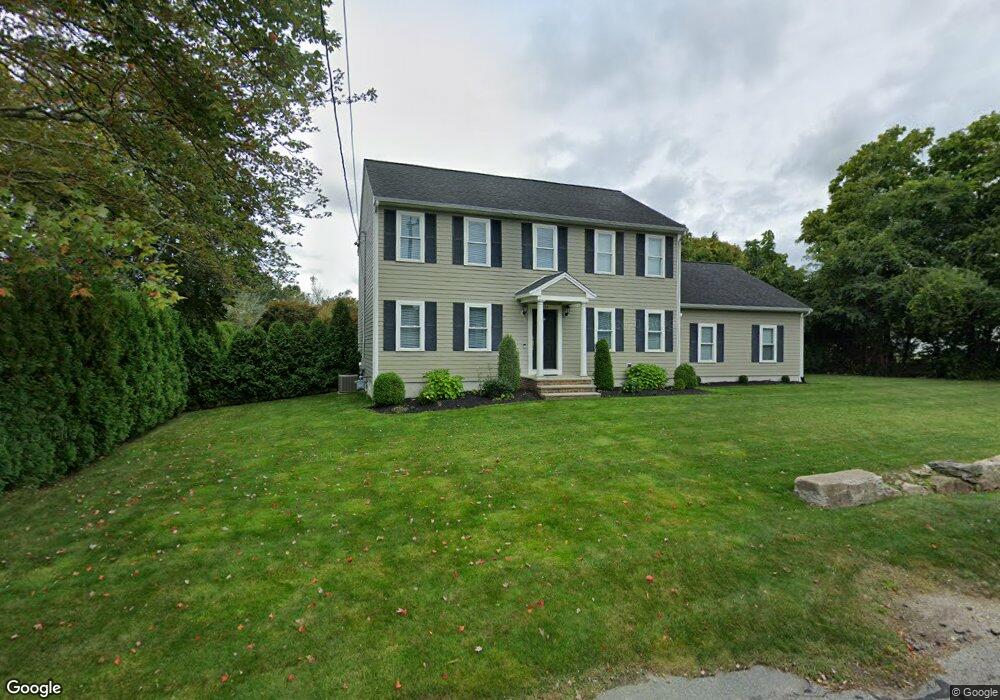
334 Russells Mills Rd South Dartmouth, MA 02748
Wilburtie Corner NeighborhoodEstimated Value: $638,000 - $829,000
3
Beds
3
Baths
2,016
Sq Ft
$352/Sq Ft
Est. Value
About This Home
This home is located at 334 Russells Mills Rd, South Dartmouth, MA 02748 and is currently estimated at $709,861, approximately $352 per square foot. 334 Russells Mills Rd is a home located in Bristol County with nearby schools including Dartmouth High School, Friends Academy, and Bishop Stang High School.
Ownership History
Date
Name
Owned For
Owner Type
Purchase Details
Closed on
Jan 30, 2009
Sold by
Dasilva Maria
Bought by
Matias Elisa F and Matias Pedro Pereira
Current Estimated Value
Home Financials for this Owner
Home Financials are based on the most recent Mortgage that was taken out on this home.
Original Mortgage
$100,000
Interest Rate
5.28%
Mortgage Type
Purchase Money Mortgage
Purchase Details
Closed on
Oct 8, 2008
Sold by
Dasilva Daniel and Mello Rachel
Bought by
Dasilva Maria
Purchase Details
Closed on
Mar 4, 2004
Sold by
Gemme Mary A
Bought by
Dasilva Danny and Mello Rachel E
Create a Home Valuation Report for This Property
The Home Valuation Report is an in-depth analysis detailing your home's value as well as a comparison with similar homes in the area
Home Values in the Area
Average Home Value in this Area
Purchase History
| Date | Buyer | Sale Price | Title Company |
|---|---|---|---|
| Matias Elisa F | $160,000 | -- | |
| Dasilva Maria | -- | -- | |
| Dasilva Danny | $60,000 | -- |
Source: Public Records
Mortgage History
| Date | Status | Borrower | Loan Amount |
|---|---|---|---|
| Open | Dasilva Danny | $300,000 | |
| Closed | Dasilva Danny | $294,000 | |
| Closed | Dasilva Danny | $100,000 |
Source: Public Records
Tax History Compared to Growth
Tax History
| Year | Tax Paid | Tax Assessment Tax Assessment Total Assessment is a certain percentage of the fair market value that is determined by local assessors to be the total taxable value of land and additions on the property. | Land | Improvement |
|---|---|---|---|---|
| 2025 | $4,454 | $517,300 | $128,500 | $388,800 |
| 2024 | $4,321 | $497,200 | $128,500 | $368,700 |
| 2023 | $4,332 | $472,400 | $128,500 | $343,900 |
| 2022 | $4,015 | $405,600 | $128,500 | $277,100 |
| 2021 | $4,066 | $392,500 | $124,800 | $267,700 |
| 2020 | $4,039 | $389,100 | $123,500 | $265,600 |
| 2019 | $3,892 | $374,200 | $118,500 | $255,700 |
| 2018 | $0 | $356,200 | $121,000 | $235,200 |
| 2017 | $3,423 | $341,600 | $111,800 | $229,800 |
| 2016 | $3,311 | $325,900 | $98,900 | $227,000 |
| 2015 | $3,262 | $321,700 | $92,400 | $229,300 |
| 2014 | $3,200 | $313,400 | $89,800 | $223,600 |
Source: Public Records
Map
Nearby Homes
- 360 Russells Mills Rd
- 3 Mishawum Dr
- 5 Samosett Dr
- 75 Country Way Unit 75
- 34 Country Way
- 6 Jacob Dr
- 76 Shipyard Ln
- 48 Wilson St
- 212 Rockland St
- 21 Avis St
- 10 Westview Dr
- 14 Westview Dr
- 33 Rosewood Terrace
- 179 Rockland St
- 29 Elizabeth Ct
- 17 Eighth Green Dr
- 25 Westwood Dr
- 1004 Allen St
- 6 Walters Way
- 98 Mccabe St
- 326 Russells Mills Rd
- 326 Russells Mills Rd Unit 1
- 344 Russells Mills Rd
- 18 Dorothy St
- 1 Massasoit Ln
- 3 Utley St
- 297 Russells Mills Rd
- 4 Utley St
- 16 Dorothy St
- 350 Russells Mills Rd
- 322 Russells Mills Rd
- 2 Massasoit Ln
- 295 Russells Mills Rd
- 5 Utley St
- 6 Utley St
- 14 Dorothy St
- 349 Russells Mills Rd
- 354 Russells Mills Rd
- 5 Viereck St
- 3 Massasoit Ln