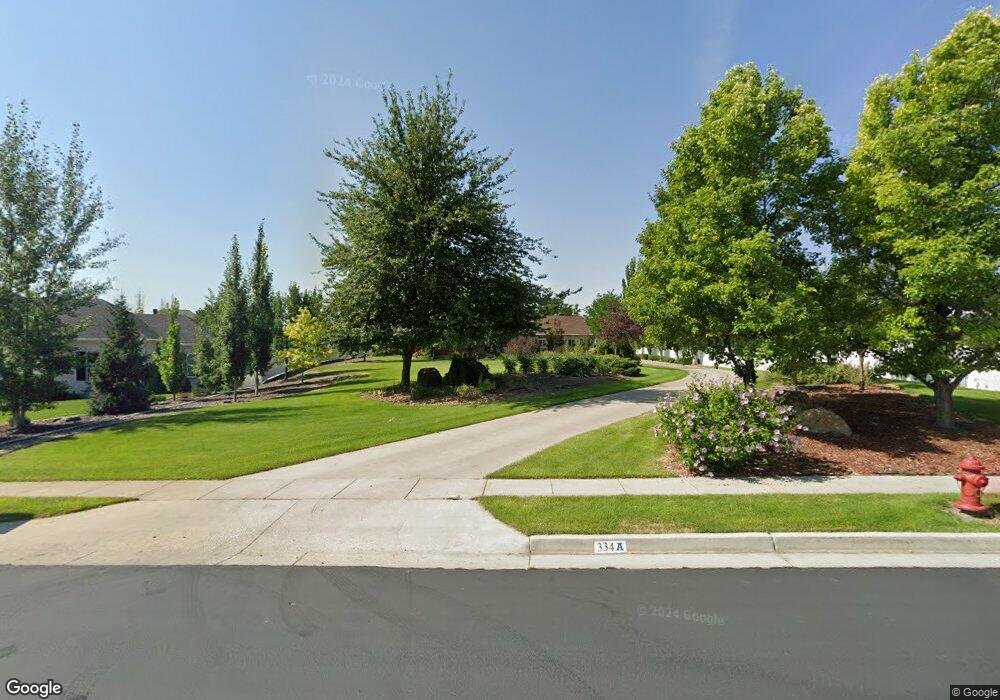
334 W 3575 S Nibley, UT 84321
Estimated Value: $570,000 - $700,000
5
Beds
3
Baths
3,372
Sq Ft
$184/Sq Ft
Est. Value
About This Home
This home is located at 334 W 3575 S, Nibley, UT 84321 and is currently estimated at $620,202, approximately $183 per square foot. 334 W 3575 S is a home located in Cache County with nearby schools including Heritage School, Spring Creek Middle School, and South Cache Middle School.
Ownership History
Date
Name
Owned For
Owner Type
Purchase Details
Closed on
Aug 8, 2017
Sold by
Duersch George A and Duersch Merl
Bought by
Green William and Green Sharie
Current Estimated Value
Purchase Details
Closed on
Dec 13, 2008
Sold by
Duersch George A and Duersch Merl
Bought by
Duersch George A and Duersch Merl
Home Financials for this Owner
Home Financials are based on the most recent Mortgage that was taken out on this home.
Original Mortgage
$185,000
Interest Rate
6.16%
Mortgage Type
New Conventional
Purchase Details
Closed on
Oct 2, 2008
Sold by
Daines Marni C and Marni C Daines Revocable Trust
Bought by
Duersch George A and Duersch Merl
Home Financials for this Owner
Home Financials are based on the most recent Mortgage that was taken out on this home.
Original Mortgage
$205,600
Interest Rate
6.43%
Mortgage Type
New Conventional
Create a Home Valuation Report for This Property
The Home Valuation Report is an in-depth analysis detailing your home's value as well as a comparison with similar homes in the area
Home Values in the Area
Average Home Value in this Area
Purchase History
| Date | Buyer | Sale Price | Title Company |
|---|---|---|---|
| Green William | -- | None Available | |
| Duersch George A | -- | American Secure Title | |
| Duersch George A | -- | Northern Title Company |
Source: Public Records
Mortgage History
| Date | Status | Borrower | Loan Amount |
|---|---|---|---|
| Previous Owner | Duersch George A | $185,000 | |
| Previous Owner | Duersch George A | $205,600 |
Source: Public Records
Tax History Compared to Growth
Tax History
| Year | Tax Paid | Tax Assessment Tax Assessment Total Assessment is a certain percentage of the fair market value that is determined by local assessors to be the total taxable value of land and additions on the property. | Land | Improvement |
|---|---|---|---|---|
| 2025 | $2,199 | $291,515 | $0 | $0 |
| 2024 | $2,346 | $291,950 | $0 | $0 |
| 2023 | $246 | $286,960 | $0 | $0 |
| 2022 | $2,563 | $286,955 | $0 | $0 |
| 2021 | $2,497 | $434,095 | $83,500 | $350,595 |
| 2020 | $2,221 | $367,619 | $83,500 | $284,119 |
| 2019 | $2,329 | $367,619 | $83,500 | $284,119 |
| 2018 | $1,999 | $307,860 | $60,800 | $247,060 |
| 2017 | $1,895 | $154,550 | $0 | $0 |
| 2016 | $1,916 | $154,550 | $0 | $0 |
| 2015 | $1,673 | $135,780 | $0 | $0 |
| 2014 | $1,635 | $135,780 | $0 | $0 |
| 2013 | -- | $140,500 | $0 | $0 |
Source: Public Records
Map
Nearby Homes
- 396 W 3650 S
- 189 W 3175 S
- 173 W 3175 S
- 3400 S 250 W Unit 2
- 262 W 3400 S Unit 11
- 324 W 3400 S Unit 7
- 278 W 3400 S Unit 10
- 294 W 3400 S Unit 9
- 308 W 3400 S Unit 8
- 338 W 3400 S Unit 6
- 268 W 3400 S Unit 5
- 191 W 3175 S Unit U629
- 191 W 3175 S
- 185 W 3175 S
- 186 W 3175 S
- 182 W 3175 S
- 3262 S 470 W
- 187 W 3175 S
- 553 S 1225 W Unit 109
- 211 W 3150 S