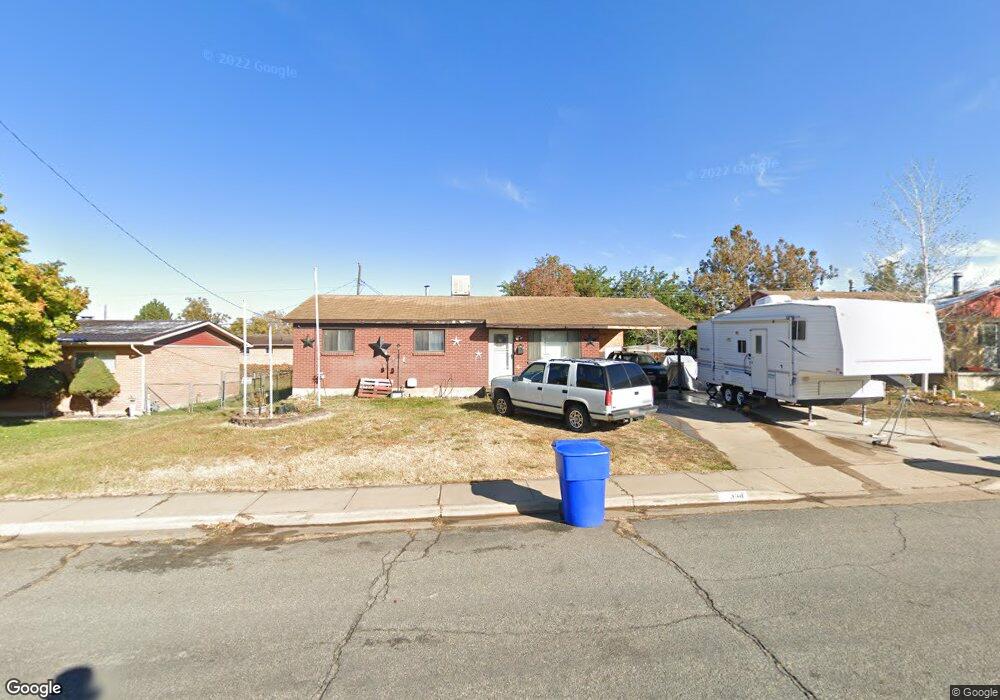
334 W 870 N Clearfield, UT 84015
Estimated Value: $368,000 - $387,000
5
Beds
2
Baths
1,950
Sq Ft
$194/Sq Ft
Est. Value
About This Home
This home is located at 334 W 870 N, Clearfield, UT 84015 and is currently estimated at $377,494, approximately $193 per square foot. 334 W 870 N is a home located in Davis County with nearby schools including Doxey Elementary School, Sunset Junior High School, and Northridge High School.
Ownership History
Date
Name
Owned For
Owner Type
Purchase Details
Closed on
Feb 26, 2001
Sold by
Magnusson Magnus A and Magnusson Angela L
Bought by
Aldridge Kenneth and Aldridge Melany
Current Estimated Value
Home Financials for this Owner
Home Financials are based on the most recent Mortgage that was taken out on this home.
Original Mortgage
$106,250
Outstanding Balance
$38,092
Interest Rate
6.98%
Estimated Equity
$339,402
Purchase Details
Closed on
Aug 22, 1996
Sold by
Robinson James D and Robinson Lesia J
Bought by
Magnusson Magnus A and Magnusson Angela L
Home Financials for this Owner
Home Financials are based on the most recent Mortgage that was taken out on this home.
Original Mortgage
$94,758
Interest Rate
8.42%
Mortgage Type
VA
Create a Home Valuation Report for This Property
The Home Valuation Report is an in-depth analysis detailing your home's value as well as a comparison with similar homes in the area
Home Values in the Area
Average Home Value in this Area
Purchase History
We collect this data history from publicly available records. To have your information removed, we recommend requesting removal directly through your county’s website.
| Date | Buyer | Sale Price | Title Company |
|---|---|---|---|
| Aldridge Kenneth | -- | Heritage West Title Insuranc | |
| Magnusson Magnus A | -- | Associated Title Company |
Source: Public Records
Mortgage History
We collect this data history from publicly available records. To have your information removed, we recommend requesting removal directly through your county’s website.
| Date | Status | Borrower | Loan Amount |
|---|---|---|---|
| Open | Aldridge Kenneth | $106,250 | |
| Previous Owner | Magnusson Magnus A | $94,758 |
Source: Public Records
Tax History
| Year | Tax Paid | Tax Assessment Tax Assessment Total Assessment is a certain percentage of the fair market value that is determined by local assessors to be the total taxable value of land and additions on the property. | Land | Improvement |
|---|---|---|---|---|
| 2025 | $2,159 | $196,900 | $72,885 | $124,015 |
| 2024 | $1,953 | $178,200 | $69,677 | $108,523 |
| 2023 | $1,828 | $304,000 | $111,447 | $192,553 |
| 2022 | $1,949 | $175,450 | $63,875 | $111,575 |
| 2021 | $1,675 | $237,000 | $68,064 | $168,936 |
| 2020 | $1,494 | $204,000 | $57,289 | $146,711 |
| 2019 | $1,401 | $200,000 | $74,017 | $125,983 |
| 2018 | $1,245 | $174,000 | $59,151 | $114,849 |
| 2016 | $1,083 | $77,715 | $27,963 | $49,752 |
| 2015 | $1,016 | $69,080 | $27,963 | $41,117 |
| 2014 | $984 | $68,366 | $28,159 | $40,207 |
| 2013 | -- | $57,385 | $23,265 | $34,120 |
Source: Public Records
Map
Nearby Homes
Your Personal Tour Guide
Ask me questions while you tour the home.