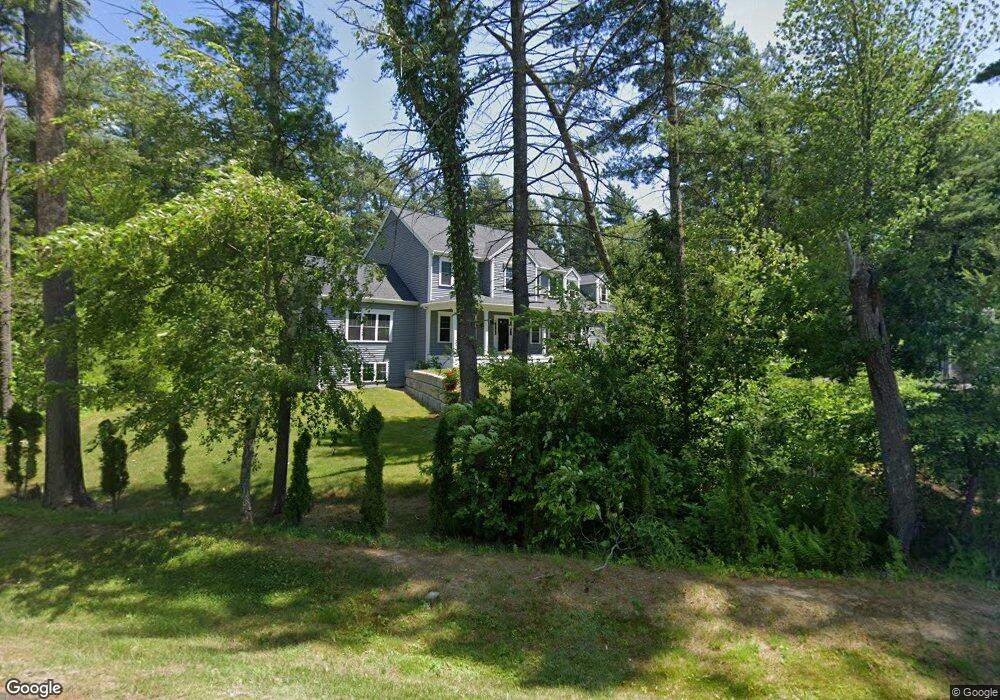
334 Walnut St Bridgewater, MA 02324
Estimated Value: $789,000 - $864,000
3
Beds
1
Bath
2,427
Sq Ft
$339/Sq Ft
Est. Value
About This Home
This home is located at 334 Walnut St, Bridgewater, MA 02324 and is currently estimated at $822,609, approximately $338 per square foot. 334 Walnut St is a home located in Plymouth County with nearby schools including Mitchell Elementary School, Williams Intermediate School, and Bridgewater Middle School.
Ownership History
Date
Name
Owned For
Owner Type
Purchase Details
Closed on
Apr 9, 2021
Sold by
Quail Hollow Llc
Bought by
Kehoe Ross and Kehoe Aubre A
Current Estimated Value
Home Financials for this Owner
Home Financials are based on the most recent Mortgage that was taken out on this home.
Original Mortgage
$455,500
Outstanding Balance
$406,970
Interest Rate
2.9%
Mortgage Type
Purchase Money Mortgage
Estimated Equity
$415,639
Purchase Details
Closed on
Jan 10, 2018
Sold by
Dorothy L Killea Ret and Killea
Bought by
Killea Brian E
Purchase Details
Closed on
Aug 31, 2017
Sold by
Dorothy L Killea Ret and Killea
Bought by
Quail Hollow Llc
Purchase Details
Closed on
Dec 12, 2008
Sold by
Killea Dorothy L
Bought by
Dorothy L Killea Ret and Killea
Purchase Details
Closed on
May 15, 1989
Sold by
Amer Heart Assn
Bought by
Killea John J
Create a Home Valuation Report for This Property
The Home Valuation Report is an in-depth analysis detailing your home's value as well as a comparison with similar homes in the area
Home Values in the Area
Average Home Value in this Area
Purchase History
| Date | Buyer | Sale Price | Title Company |
|---|---|---|---|
| Kehoe Ross | $575,500 | None Available | |
| Killea Brian E | -- | -- | |
| Quail Hollow Llc | $300,000 | -- | |
| Dorothy L Killea Ret | -- | -- | |
| Killea John J | $50,000 | -- | |
| Killea John J | $50,000 | -- |
Source: Public Records
Mortgage History
| Date | Status | Borrower | Loan Amount |
|---|---|---|---|
| Open | Kehoe Ross | $455,500 | |
| Previous Owner | Killea John J | $50,000 |
Source: Public Records
Tax History
| Year | Tax Paid | Tax Assessment Tax Assessment Total Assessment is a certain percentage of the fair market value that is determined by local assessors to be the total taxable value of land and additions on the property. | Land | Improvement |
|---|---|---|---|---|
| 2025 | $9,146 | $773,100 | $237,200 | $535,900 |
| 2024 | $8,950 | $737,200 | $225,900 | $511,300 |
| 2023 | $8,915 | $694,300 | $211,100 | $483,200 |
| 2022 | $5,724 | $399,700 | $185,200 | $214,500 |
| 2021 | $2,023 | $139,700 | $137,900 | $1,800 |
| 2020 | $2,000 | $135,800 | $134,000 | $1,800 |
| 2019 | $2,014 | $135,800 | $134,000 | $1,800 |
| 2018 | $4,404 | $289,900 | $140,800 | $149,100 |
| 2017 | $4,383 | $280,800 | $140,800 | $140,000 |
| 2016 | $4,270 | $274,800 | $138,100 | $136,700 |
| 2015 | $4,367 | $268,900 | $134,000 | $134,900 |
| 2014 | $4,232 | $260,400 | $124,100 | $136,300 |
Source: Public Records
Map
Nearby Homes
- 3 Caswell Way
- 199 Cherry St
- 211 Cherry St
- 0 Auburn St
- 845 Plymouth St
- 150 Prattown Ln
- Lot 1 Mill St
- 829 Auburn St
- 73 Pratt Ave
- 101 Pratt Ave
- 74 Magnolia Way
- 0 Flagg St Unit 73421818
- 44 Titicut Ave Unit Lot 45
- 46 Titicut Ave
- 17 Forbes Rd Unit Lot 64
- 225 Whitman St
- 215 Whitman St
- 114 Plain St
- 5 Country Dr
- 24 High Pond Dr
Your Personal Tour Guide
Ask me questions while you tour the home.