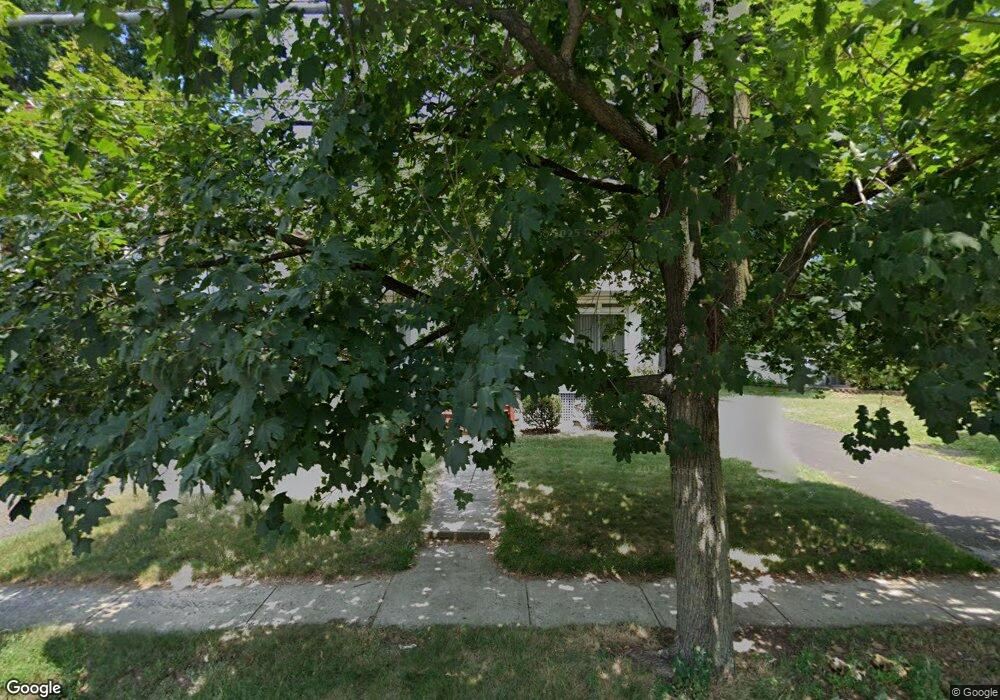
334 Walnut St Dunellen, NJ 08812
Estimated Value: $411,000 - $501,000
Studio
--
Bath
840
Sq Ft
$535/Sq Ft
Est. Value
About This Home
This home is located at 334 Walnut St, Dunellen, NJ 08812 and is currently estimated at $449,083, approximately $534 per square foot. 334 Walnut St is a home located in Middlesex County with nearby schools including John P. Faber Elementary School, Lincoln Middle School, and Dunellen High School.
Ownership History
Date
Name
Owned For
Owner Type
Purchase Details
Closed on
Sep 14, 2000
Sold by
Cunningham Susan
Bought by
Brosky Mark
Current Estimated Value
Home Financials for this Owner
Home Financials are based on the most recent Mortgage that was taken out on this home.
Original Mortgage
$102,000
Outstanding Balance
$36,806
Interest Rate
7.96%
Estimated Equity
$412,277
Purchase Details
Closed on
Feb 28, 1994
Sold by
Flanagan John
Bought by
Cunningham Susan
Home Financials for this Owner
Home Financials are based on the most recent Mortgage that was taken out on this home.
Original Mortgage
$88,000
Interest Rate
7.01%
Create a Home Valuation Report for This Property
The Home Valuation Report is an in-depth analysis detailing your home's value as well as a comparison with similar homes in the area
Home Values in the Area
Average Home Value in this Area
Purchase History
| Date | Buyer | Sale Price | Title Company |
|---|---|---|---|
| Brosky Mark | $124,000 | -- | |
| Cunningham Susan | $93,000 | -- |
Source: Public Records
Mortgage History
| Date | Status | Borrower | Loan Amount |
|---|---|---|---|
| Open | Brosky Mark | $102,000 | |
| Previous Owner | Cunningham Susan | $88,000 |
Source: Public Records
Tax History
| Year | Tax Paid | Tax Assessment Tax Assessment Total Assessment is a certain percentage of the fair market value that is determined by local assessors to be the total taxable value of land and additions on the property. | Land | Improvement |
|---|---|---|---|---|
| 2025 | $9,031 | $410,500 | $106,600 | $303,900 |
| 2024 | $8,771 | $360,100 | $106,600 | $253,500 |
Source: Public Records
Map
Nearby Homes
- 228 Park Ln
- 1894 W 4th St
- 250 Whittier Ave
- 1899 W 4th St
- 241 Orange St
- 203 S Washington Ave
- 118 Jadach Dr
- 219 Gertrude Terrace
- 400 Valmere Ave
- 423 New Market Rd
- 364 S Madison Ave
- 309-311 Pulaski St
- 577 S South Ave S
- 419 Dunellen Ave
- 529 Dunellen Ave
- 12 Jefferson Ave
- 1758 S 2nd St
- 1 Hall St
- 220 1st St
- 417 2nd St
Your Personal Tour Guide
Ask me questions while you tour the home.