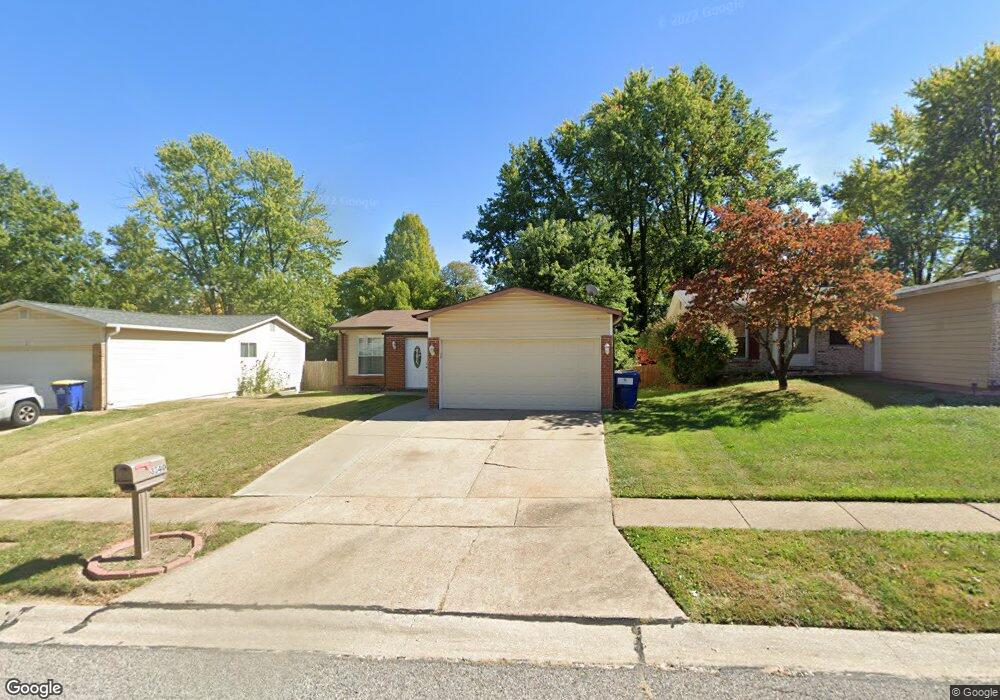
3340 Greenway Chase Dr Florissant, MO 63031
Estimated Value: $160,000 - $185,000
3
Beds
1
Bath
998
Sq Ft
$176/Sq Ft
Est. Value
About This Home
This home is located at 3340 Greenway Chase Dr, Florissant, MO 63031 and is currently estimated at $175,616, approximately $175 per square foot. 3340 Greenway Chase Dr is a home located in St. Louis County with nearby schools including North Middle School, Hazelwood Central High School, and St Norbert School.
Ownership History
Date
Name
Owned For
Owner Type
Purchase Details
Closed on
May 29, 2025
Sold by
Jenkins Donald V
Bought by
Walker Kenyata
Current Estimated Value
Home Financials for this Owner
Home Financials are based on the most recent Mortgage that was taken out on this home.
Original Mortgage
$180,420
Outstanding Balance
$179,957
Interest Rate
6.81%
Estimated Equity
-$4,341
Purchase Details
Closed on
Aug 29, 2019
Sold by
Goodin Tameshia
Bought by
Jenkins Donald
Purchase Details
Closed on
Mar 7, 2014
Sold by
Liu Wei and Wang Xueying
Bought by
Goodin Tameshia
Purchase Details
Closed on
Oct 17, 2003
Sold by
Medlin Anthony D and Medlin Janice
Bought by
Liu Wei and Wang Xueying
Purchase Details
Closed on
Dec 20, 1999
Sold by
Medlin Anthony J and Medlin Janice
Bought by
Medlin Anthony J and Medlin Janice
Create a Home Valuation Report for This Property
The Home Valuation Report is an in-depth analysis detailing your home's value as well as a comparison with similar homes in the area
Home Values in the Area
Average Home Value in this Area
Purchase History
| Date | Buyer | Sale Price | Title Company |
|---|---|---|---|
| Walker Kenyata | -- | True Title | |
| Jenkins Donald | -- | None Available | |
| Goodin Tameshia | $41,000 | Continental Title Company | |
| Liu Wei | $78,100 | -- | |
| Medlin Anthony J | -- | -- |
Source: Public Records
Mortgage History
| Date | Status | Borrower | Loan Amount |
|---|---|---|---|
| Open | Walker Kenyata | $180,420 | |
| Closed | Walker Kenyata | $180,420 |
Source: Public Records
Tax History Compared to Growth
Tax History
| Year | Tax Paid | Tax Assessment Tax Assessment Total Assessment is a certain percentage of the fair market value that is determined by local assessors to be the total taxable value of land and additions on the property. | Land | Improvement |
|---|---|---|---|---|
| 2025 | $2,418 | $31,960 | $5,190 | $26,770 |
| 2024 | $2,418 | $27,640 | $2,070 | $25,570 |
| 2023 | $2,418 | $27,640 | $2,070 | $25,570 |
| 2022 | $1,990 | $20,250 | $3,400 | $16,850 |
| 2021 | $1,962 | $20,250 | $3,400 | $16,850 |
| 2020 | $1,837 | $17,640 | $5,190 | $12,450 |
| 2019 | $1,809 | $17,640 | $5,190 | $12,450 |
| 2018 | $1,676 | $15,010 | $1,770 | $13,240 |
| 2017 | $1,674 | $15,010 | $1,770 | $13,240 |
| 2016 | $1,316 | $11,590 | $2,110 | $9,480 |
| 2015 | $1,288 | $11,590 | $2,110 | $9,480 |
| 2014 | $1,251 | $11,590 | $1,940 | $9,650 |
Source: Public Records
Map
Nearby Homes
- 1455 Burnside Ct
- 1638 Matlock Dr
- 1522 Sherwood Forest Dr
- 1323 Woodpath Dr
- 1641 Sherwood Forest Dr
- 3213 Yvette Ct
- 1807 Kilmory Dr
- 1114 Ransome Ct
- 3035 Matlock Dr
- 3660 Woodman Dr
- 3645 Woodman Dr
- 2906 Russet Ct
- 2916 Corn Silk Ct
- 985 Brookfield Chase Ct
- 3870 Hope Haven Dr
- 733 Mediterranean Dr
- 3849 Secretariat Dr
- 2 Aspen II at Riverstone
- 16787 River Stone Dr
- 2932 Sherwood Dr
- 3320 Greenway Chase Dr
- 3360 Greenway Chase Dr
- 3300 Greenway Chase Dr
- 3370 Greenway Chase Dr
- 3303 Green Pasture Dr
- 3313 Green Pasture Dr
- 3293 Green Pasture Dr
- 3323 Green Pasture Dr
- 3290 Greenway Chase Dr
- 3283 Green Pasture Dr
- 3390 Greenway Chase Dr
- 3365 Greenway Chase Dr
- 3333 Green Pasture Dr
- 3335 Greenway Chase Dr
- 3273 Green Pasture Dr
- 3260 Greenway Chase Dr
- 3385 Greenway Chase Dr
- 3325 Greenway Chase Dr
- 3343 Green Pasture Dr
- 3263 Green Pasture Dr