Estimated Value: $228,380 - $257,000
3
Beds
2
Baths
1,601
Sq Ft
$149/Sq Ft
Est. Value
About This Home
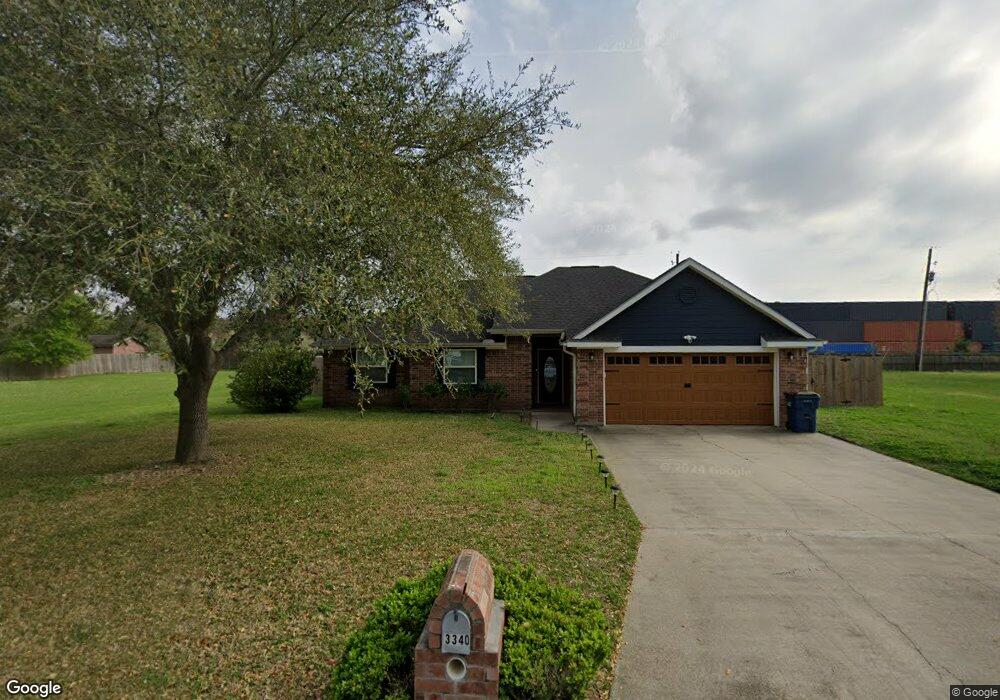
This home is located at 3340 Michelle Ave, Vidor, TX 77662 and is currently estimated at $238,095, approximately $148 per square foot. 3340 Michelle Ave is a home located in Orange County.
Ownership History
Date
Name
Owned For
Owner Type
Purchase Details
Closed on
Sep 25, 2024
Sold by
May Lance David and May Heather M
Bought by
Bagley Bree and Garrison Cierra
Current Estimated Value
Home Financials for this Owner
Home Financials are based on the most recent Mortgage that was taken out on this home.
Original Mortgage
$227,272
Outstanding Balance
$224,507
Interest Rate
6.49%
Mortgage Type
New Conventional
Estimated Equity
$13,588
Purchase Details
Closed on
Mar 3, 2021
Sold by
Snowden Michael and Snowden Shambree
Bought by
May Lance David and May Heather M
Home Financials for this Owner
Home Financials are based on the most recent Mortgage that was taken out on this home.
Original Mortgage
$185,000
Interest Rate
3.1%
Mortgage Type
VA
Purchase Details
Closed on
Jul 22, 2020
Sold by
Carroll Jason and Carroll Michelle
Bought by
Snowden Michael and Snowden Shambree
Purchase Details
Closed on
Jun 15, 2001
Sold by
Unknown Seller
Bought by
Carroll Jason D
Create a Home Valuation Report for This Property
The Home Valuation Report is an in-depth analysis detailing your home's value as well as a comparison with similar homes in the area
Home Values in the Area
Average Home Value in this Area
Purchase History
| Date | Buyer | Sale Price | Title Company |
|---|---|---|---|
| Bagley Bree | $227,272 | Capital Title | |
| May Lance David | -- | Texas Regional Title | |
| Snowden Michael | -- | Capital Title | |
| Carroll Jason D | -- | -- |
Source: Public Records
Mortgage History
| Date | Status | Borrower | Loan Amount |
|---|---|---|---|
| Open | Bagley Bree | $227,272 | |
| Previous Owner | May Lance David | $185,000 |
Source: Public Records
Tax History Compared to Growth
Tax History
| Year | Tax Paid | Tax Assessment Tax Assessment Total Assessment is a certain percentage of the fair market value that is determined by local assessors to be the total taxable value of land and additions on the property. | Land | Improvement |
|---|---|---|---|---|
| 2025 | $3,162 | $114,029 | $7,840 | $106,189 |
| 2024 | $1,399 | $228,057 | $15,680 | $212,377 |
| 2023 | $2,659 | $170,269 | $12,544 | $157,725 |
| 2022 | $2,647 | $148,424 | $12,544 | $135,880 |
| 2021 | $2,536 | $136,344 | $12,544 | $123,800 |
| 2020 | $1,106 | $57,704 | $12,544 | $45,160 |
| 2019 | $2,348 | $121,494 | $12,544 | $108,950 |
| 2018 | $735 | $38,464 | $12,544 | $25,920 |
| 2017 | $1,631 | $116,254 | $12,544 | $103,710 |
| 2016 | $2,159 | $113,094 | $12,544 | $100,550 |
| 2015 | $1,548 | $107,601 | $12,544 | $95,057 |
| 2014 | $1,548 | $104,344 | $12,544 | $91,800 |
Source: Public Records
Map
Nearby Homes
- 3455 Michelle Ave
- 230 Christel
- 15600 Interstate 10
- 15600 Interstate 10
- 15660 Interstate 10
- 486 Parish Rd
- 346 Callie Ln
- 559 Doty Rd
- 13385 Interstate 10 E
- 1217 Liston Rd
- 9010 Terry Estates Dr
- 950 Millie St
- 0 Fm 1132 Unit 93970706
- 4010 Shadowdale Ln
- 8594 Morgan Ln
- 0 Edgewood
- 12575 Ih-10 E
- 9861 Fm 1442
- 4560 Townsend Dr
- 3665 E Railroad St
- 3490 Michelle Ave
- 3500 Michelle Ave
- 3320 Michelle Ave
- 3345 Michelle Ave
- 3355 Michelle Ave
- 3335 Michelle Ave
- 3365 Michelle Ave
- 0 Michelle Ave
- 3315 Michelle Ave
- 3400 Michelle Ave
- 3305 Michelle Ave
- 3405 Michelle Ave
- 3410 Michelle Ave
- 3295 Michelle Ave
- 3415 Michelle Ave
- 3280 Michelle Ave
- 3420 Michelle Ave
- 3275 Michelle Ave
- 3430 Michelle Ave
- 3260 Michelle Ave