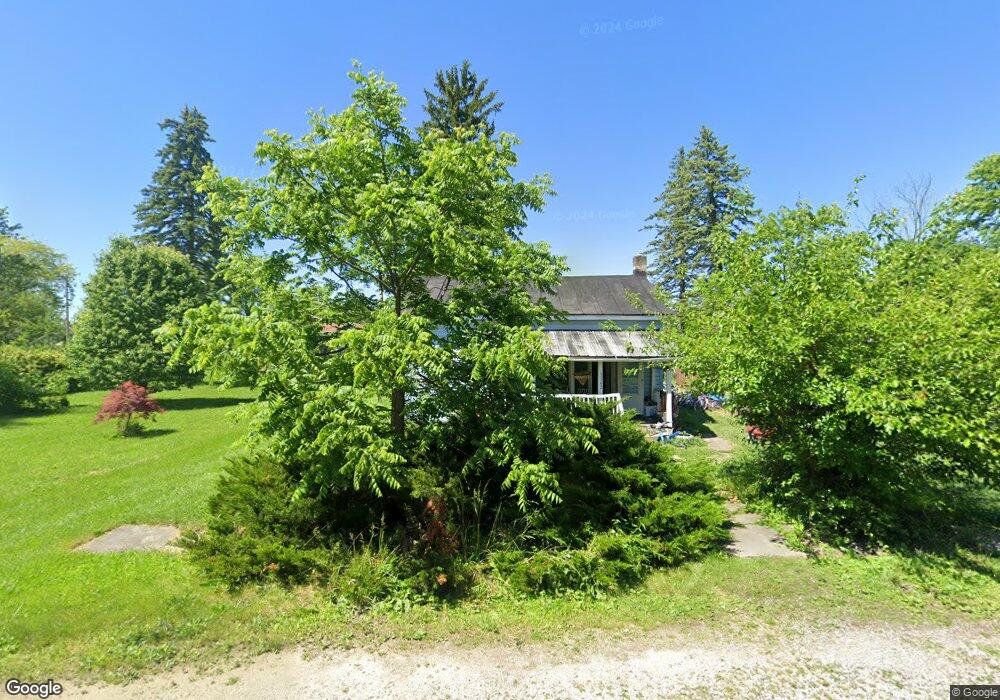
3342 George St Burgoon, OH 43407
Estimated Value: $76,613 - $146,000
2
Beds
1
Bath
1,120
Sq Ft
$99/Sq Ft
Est. Value
About This Home
This home is located at 3342 George St, Burgoon, OH 43407 and is currently estimated at $110,403, approximately $98 per square foot. 3342 George St is a home located in Sandusky County with nearby schools including Lakota Elementary School, Lakota Middle School, and Lakota High School.
Ownership History
Date
Name
Owned For
Owner Type
Purchase Details
Closed on
Sep 12, 2014
Sold by
Gallagher Danny
Bought by
Tyson Jarret
Current Estimated Value
Purchase Details
Closed on
Aug 26, 2009
Sold by
Tyson Jarret
Bought by
Gallagher Danny
Purchase Details
Closed on
Jan 2, 2008
Sold by
Rev Edmund Mormon Hall Inc
Bought by
Gallagher Danny and Tyson Jarret
Home Financials for this Owner
Home Financials are based on the most recent Mortgage that was taken out on this home.
Original Mortgage
$6,000
Interest Rate
6.27%
Mortgage Type
Unknown
Purchase Details
Closed on
Jun 25, 2007
Sold by
Stahl John M
Bought by
Rev Edmund Mormon Hall Inc
Purchase Details
Closed on
Jun 2, 2003
Sold by
Day Star Farm Inc
Bought by
Rey Edmund Mormon Hall Inc
Purchase Details
Closed on
May 29, 2003
Sold by
Stahl John M
Bought by
Day Star Farm Inc
Purchase Details
Closed on
Jul 6, 2001
Sold by
Tms Mortgage Inc
Bought by
David W Stahl Trst
Create a Home Valuation Report for This Property
The Home Valuation Report is an in-depth analysis detailing your home's value as well as a comparison with similar homes in the area
Home Values in the Area
Average Home Value in this Area
Purchase History
| Date | Buyer | Sale Price | Title Company |
|---|---|---|---|
| Tyson Jarret | -- | Attorney | |
| Gallagher Danny | -- | Attorney | |
| Gallagher Danny | -- | Attorney | |
| Rev Edmund Mormon Hall Inc | -- | None Available | |
| Rey Edmund Mormon Hall Inc | -- | -- | |
| Day Star Farm Inc | -- | -- | |
| David W Stahl Trst | $4,800 | -- |
Source: Public Records
Mortgage History
| Date | Status | Borrower | Loan Amount |
|---|---|---|---|
| Previous Owner | Gallagher Danny | $6,000 |
Source: Public Records
Tax History Compared to Growth
Tax History
| Year | Tax Paid | Tax Assessment Tax Assessment Total Assessment is a certain percentage of the fair market value that is determined by local assessors to be the total taxable value of land and additions on the property. | Land | Improvement |
|---|---|---|---|---|
| 2024 | $5,447 | $16,840 | $4,520 | $12,320 |
| 2023 | $706 | $13,580 | $3,640 | $9,940 |
| 2022 | $1,528 | $13,580 | $3,640 | $9,940 |
| 2021 | $669 | $13,580 | $3,640 | $9,940 |
| 2020 | $496 | $12,250 | $3,640 | $8,610 |
| 2019 | $5,489 | $12,250 | $3,640 | $8,610 |
| 2018 | $792 | $12,250 | $3,640 | $8,610 |
| 2017 | $989 | $11,480 | $3,640 | $7,840 |
| 2016 | $1,205 | $11,480 | $3,640 | $7,840 |
| 2015 | $544 | $11,480 | $3,640 | $7,840 |
| 2014 | $582 | $11,940 | $3,680 | $8,260 |
| 2013 | $1,474 | $11,940 | $3,680 | $8,260 |
Source: Public Records
Map
Nearby Homes
- 0 State Route 590 Unit 6136844
- 2595 County Road 13
- 230 State St
- 203 Washington St
- 0 State Route 224 Unit 20240095
- 8399 N County Road 31
- 2231 County Road 23
- 6780 W Township Road 174
- 7934 Pleasant Rd
- 17 Adams Dr
- 855 Rambo Ln
- 227 Main St
- 4885 N Township Road 101
- 0 Ohio 590
- 132 E Township Road 152
- 5479 N State Route 53
- 0 County Road 90
- 2484 Buckland Ave
- 3166 N County Road 11
- 0 County Road 59