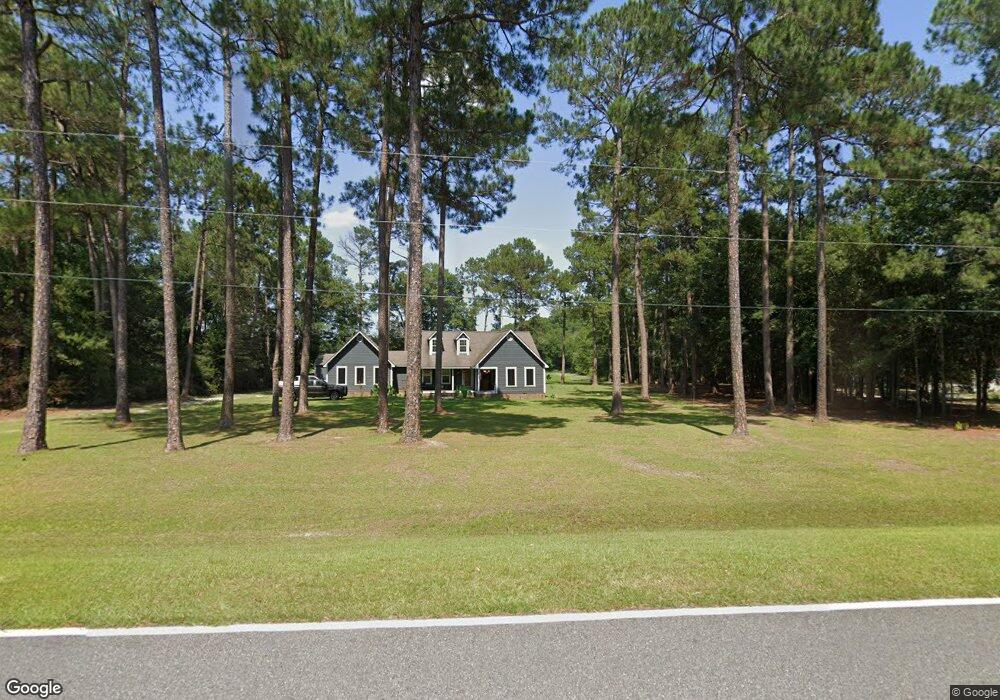
3343 Chula Brookfield Rd Tifton, GA 31794
Estimated Value: $174,000 - $219,000
3
Beds
2
Baths
1,444
Sq Ft
$135/Sq Ft
Est. Value
About This Home
This home is located at 3343 Chula Brookfield Rd, Tifton, GA 31794 and is currently estimated at $195,219, approximately $135 per square foot. 3343 Chula Brookfield Rd is a home located in Tift County with nearby schools including Matt Wilson Elementary School, J.T. Reddick School, and Annie Belle Clark Primary School.
Ownership History
Date
Name
Owned For
Owner Type
Purchase Details
Closed on
May 9, 2019
Sold by
Nixon Clarence
Bought by
Baker George and Baker Beverly Dawn
Current Estimated Value
Home Financials for this Owner
Home Financials are based on the most recent Mortgage that was taken out on this home.
Original Mortgage
$146,900
Outstanding Balance
$128,893
Interest Rate
4.1%
Estimated Equity
$66,327
Purchase Details
Closed on
Jun 16, 2004
Sold by
Hand Ronald R Etal
Bought by
Updyke Gregory and Updyke Tracy H
Purchase Details
Closed on
Jun 11, 2004
Sold by
Moore Jeremy and Moore Charlsie
Bought by
Nixon Clarence and Nixon Athena
Purchase Details
Closed on
Dec 17, 1999
Sold by
Hudgins Chris E
Bought by
Moore Jeremy
Purchase Details
Closed on
Apr 4, 1995
Sold by
Berry Richard L and Berry Brenda
Bought by
Hudgins Chris E and Hudgins Cassandra C
Purchase Details
Closed on
Aug 31, 1989
Sold by
Updyke Gregory and Updyke Tracy H
Bought by
Berry Richard L and Berry Brenda
Purchase Details
Closed on
May 20, 1987
Sold by
Updyke Gregory and Updyke Tracy H
Bought by
Sumner J Dale
Create a Home Valuation Report for This Property
The Home Valuation Report is an in-depth analysis detailing your home's value as well as a comparison with similar homes in the area
Home Values in the Area
Average Home Value in this Area
Purchase History
| Date | Buyer | Sale Price | Title Company |
|---|---|---|---|
| Baker George | $146,900 | -- | |
| Updyke Gregory | -- | -- | |
| Nixon Clarence | $102,000 | -- | |
| Moore Jeremy | $89,900 | -- | |
| Hudgins Chris E | $69,000 | -- | |
| Berry Richard L | $62,900 | -- | |
| Sumner J Dale | $50,000 | -- |
Source: Public Records
Mortgage History
| Date | Status | Borrower | Loan Amount |
|---|---|---|---|
| Open | Baker George | $146,900 |
Source: Public Records
Tax History Compared to Growth
Tax History
| Year | Tax Paid | Tax Assessment Tax Assessment Total Assessment is a certain percentage of the fair market value that is determined by local assessors to be the total taxable value of land and additions on the property. | Land | Improvement |
|---|---|---|---|---|
| 2024 | -- | $58,907 | $2,536 | $56,371 |
| 2023 | $0 | $38,583 | $3,154 | $35,429 |
| 2022 | $1,145 | $38,583 | $3,154 | $35,429 |
| 2021 | $1,152 | $38,583 | $3,154 | $35,429 |
| 2020 | $1,175 | $38,583 | $3,154 | $35,429 |
| 2019 | $1,118 | $38,813 | $3,154 | $35,659 |
| 2018 | $1,116 | $38,813 | $3,154 | $35,659 |
| 2017 | $1,121 | $38,813 | $3,154 | $35,659 |
| 2016 | $1,122 | $38,813 | $3,154 | $35,659 |
| 2015 | $1,123 | $38,813 | $3,154 | $35,659 |
| 2014 | $1,125 | $38,813 | $3,154 | $35,659 |
| 2013 | -- | $38,813 | $3,154 | $35,659 |
Source: Public Records
Map
Nearby Homes
- 3365 Chula Brookfield Rd
- 21 Brookfield-Lenox Rd
- 0 Stone Bridge Rd
- 204 Brookfield Nashville Rd
- 287 Brookfield Nashville Rd
- 58 Honeysuckle Ln
- 2066 U S 82
- 0 Baker Rd
- 39 Paradise Lake Rd
- Tract 5 Harold Tyson Rd
- Tract 5 Jehu Tyson Rd
- Tract 6 Jehu Tyson Rd
- Tract 2 Harold Tyson Rd
- 2635 Brookfield-Lenox Rd
- Tract 3 Harold Tyson Rd
- 395 Harris St
- 2242 U S 82
- 1922 Turner Church Rd
- 339 Chapel Hill Cir Unit 15
- 339 Chapel Hill Cir
- 3351 Chula Brookfield Rd
- 3331 Chula Brookfield Rd
- 3377 Chula Brookfield Rd
- 2441 Us Highway 82 E
- 0 Chula Brookfield Rd
- 2470 Us Highway 82 E
- 20 Smith Ct
- 2440 Us Highway 82 E
- 12 Railroad Cir
- 495 Rr5
- 2504 Us Highway 82 E
- 990 Lower Brookfield Rd
- 996 Lower Brookfield Rd
- 2516 Us Highway 82 E
- 984 Lower Brookfield Rd
- 3255 Chula Brookfield Rd
- 980 Lower Brookfield Rd
- 2420 Us Highway 82 E
- 975 Lower Brookfield Rd
- 2512 Us Highway 82 E