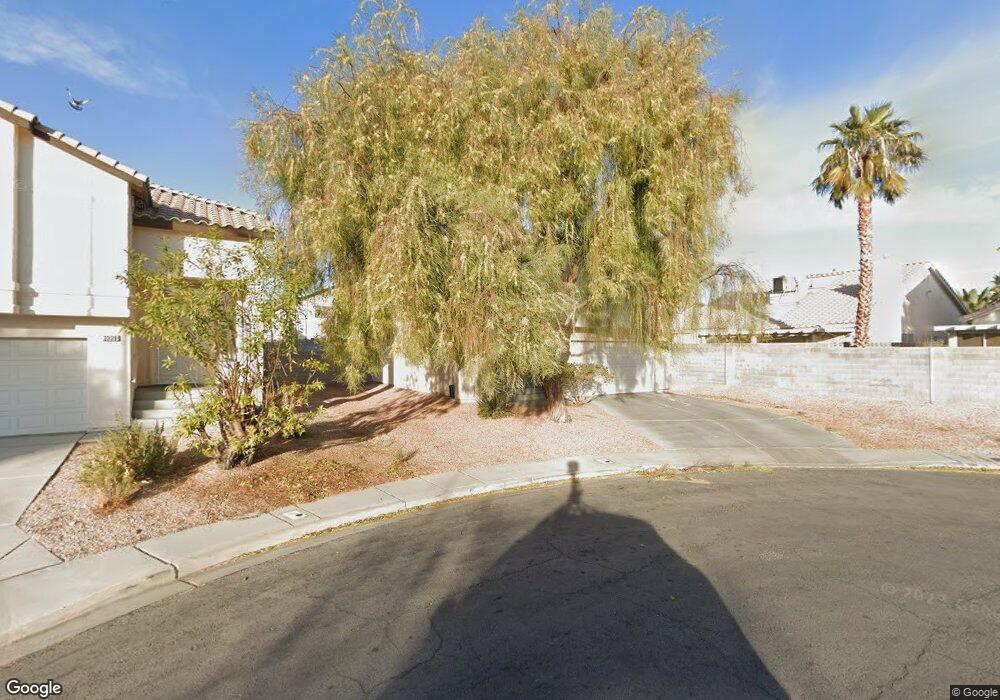
3343 Flying Colt Ct North Las Vegas, NV 89032
Cheyenne NeighborhoodEstimated Value: $393,344 - $416,000
4
Beds
2
Baths
1,753
Sq Ft
$233/Sq Ft
Est. Value
About This Home
This home is located at 3343 Flying Colt Ct, North Las Vegas, NV 89032 and is currently estimated at $408,086, approximately $232 per square foot. 3343 Flying Colt Ct is a home located in Clark County with nearby schools including Claude & Stella Parson Elementary School, Theron L Swainston Middle School, and Cheyenne High School.
Ownership History
Date
Name
Owned For
Owner Type
Purchase Details
Closed on
Mar 7, 2022
Sold by
Offerpad Spe Borrower A Llc
Bought by
Mch Sfr Property Owner 3 Llc
Current Estimated Value
Purchase Details
Closed on
Jan 6, 2022
Sold by
Cal Irene
Bought by
Offerpad Spe Borrower A Llc
Purchase Details
Closed on
May 6, 2003
Sold by
Rygaard Lars S
Bought by
Celebrate Homes Vii Llc
Purchase Details
Closed on
Nov 8, 2002
Sold by
Celebrate Homes Vii Llc
Bought by
Cal Irene
Home Financials for this Owner
Home Financials are based on the most recent Mortgage that was taken out on this home.
Original Mortgage
$159,979
Interest Rate
6.06%
Mortgage Type
FHA
Purchase Details
Closed on
Mar 12, 2002
Sold by
Celebrate Homes Vii Llc
Bought by
Rygaard Lars S
Home Financials for this Owner
Home Financials are based on the most recent Mortgage that was taken out on this home.
Original Mortgage
$144,891
Interest Rate
6.43%
Create a Home Valuation Report for This Property
The Home Valuation Report is an in-depth analysis detailing your home's value as well as a comparison with similar homes in the area
Home Values in the Area
Average Home Value in this Area
Purchase History
| Date | Buyer | Sale Price | Title Company |
|---|---|---|---|
| Mch Sfr Property Owner 3 Llc | $410,000 | First Integrity Title | |
| Offerpad Spe Borrower A Llc | $324,000 | First American Title | |
| Celebrate Homes Vii Llc | -- | Nevada Title Company | |
| Cal Irene | $162,490 | Nevada Title Company | |
| Rygaard Lars S | $161,490 | Nevada Title Company |
Source: Public Records
Mortgage History
| Date | Status | Borrower | Loan Amount |
|---|---|---|---|
| Previous Owner | Cal Irene | $159,979 | |
| Previous Owner | Rygaard Lars S | $144,891 |
Source: Public Records
Tax History Compared to Growth
Tax History
| Year | Tax Paid | Tax Assessment Tax Assessment Total Assessment is a certain percentage of the fair market value that is determined by local assessors to be the total taxable value of land and additions on the property. | Land | Improvement |
|---|---|---|---|---|
| 2025 | $1,649 | $94,715 | $28,350 | $66,365 |
| 2024 | $1,528 | $94,715 | $28,350 | $66,365 |
| 2023 | $1,528 | $91,293 | $28,700 | $62,593 |
| 2022 | $1,415 | $82,805 | $25,550 | $57,255 |
| 2021 | $1,310 | $76,798 | $22,400 | $54,398 |
| 2020 | $1,269 | $74,972 | $21,000 | $53,972 |
| 2019 | $1,254 | $70,587 | $17,500 | $53,087 |
| 2018 | $1,196 | $65,455 | $14,700 | $50,755 |
| 2017 | $1,996 | $59,507 | $12,250 | $47,257 |
| 2016 | $1,121 | $52,023 | $9,450 | $42,573 |
| 2015 | $1,118 | $37,090 | $5,250 | $31,840 |
| 2014 | $1,085 | $32,943 | $5,250 | $27,693 |
Source: Public Records
Map
Nearby Homes
- 4525 Ranch Foreman Rd
- 4542 Silver Bit Ct
- 4444 Cave Lake Ave
- 4436 Cave Lake Ave
- 4707 Chestnut Blaze Dr
- 4428 Cave Lake Ave
- 3240 Lunar Crater St
- 4420 Cave Lake Ave
- 3318 N Decatur Blvd Unit 2086
- 3318 N Decatur Blvd Unit 2149
- 3318 N Decatur Blvd Unit 2143
- 3318 N Decatur Blvd Unit 2112
- 3318 N Decatur Blvd Unit 1088
- 3318 N Decatur Blvd Unit 2072
- 3318 N Decatur Blvd Unit 1092
- 3318 N Decatur Blvd Unit 1043
- 3318 N Decatur Blvd Unit 2007
- 3318 N Decatur Blvd Unit 2057
- 3318 N Decatur Blvd Unit 2083
- 3318 N Decatur Blvd Unit 1013
- 3339 Flying Colt Ct
- 4533 Bucking Bronco Rd
- 4537 Bucking Bronco Rd
- 4529 Bucking Bronco Rd
- 3344 Strawberry Roan Rd Unit 3
- 3335 Flying Colt Ct Unit 3
- 3346 Strawberry Roan Rd
- 3340 Strawberry Roan Rd
- 4525 Bucking Bronco Rd
- 3350 Strawberry Roan Rd
- 3336 Strawberry Roan Rd
- 3331 Flying Colt Ct
- 3342 Flying Colt Ct
- 4521 Bucking Bronco Rd
- 3338 Flying Colt Ct
- 3332 Strawberry Roan Rd
- 3407 White Stallion Ct
- 3327 Flying Colt Ct
- 4517 Bucking Bronco Rd
- 3330 Flying Colt Ct